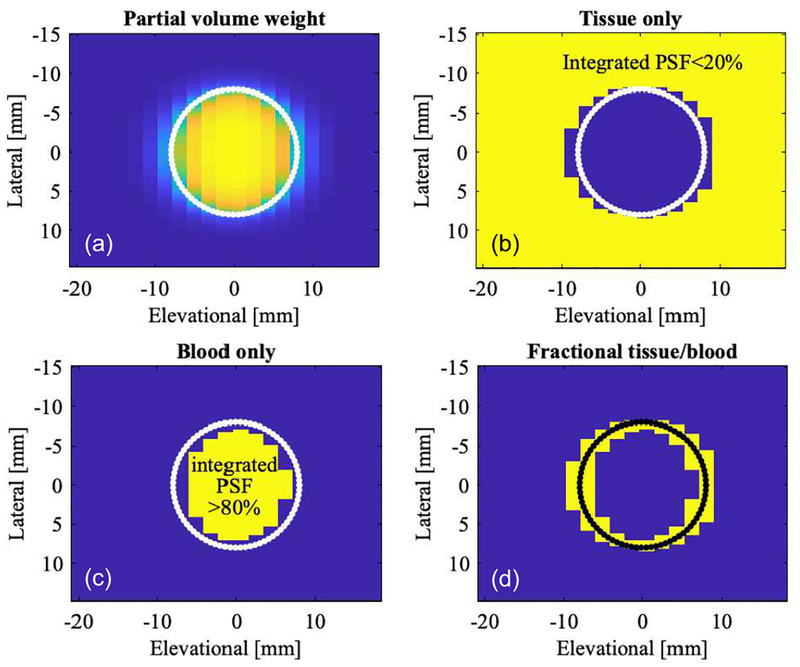
Fig. 8.
Lateral-elevational cross-section showing color flow beam voxels in the c-plane. Assuming a finite beam shape, i.e., each voxel is evaluated based on its integrated color beam point-spread-function cropped by the geometry of the lumen (4). (a) Color coded partial volume voxels, 0% blood (blue) in tissue background and 100% blood (yellow) in the lumen. Partial voxels are shaded from blue to yellow. (b) Image showing 100% tissue (yellow). (c) Image showing 100% blood (yellow). (d) Image showing only partial volume voxels (yellow). The simulated lumen of 16-mm diameter is indicated in each image as a solid line.

