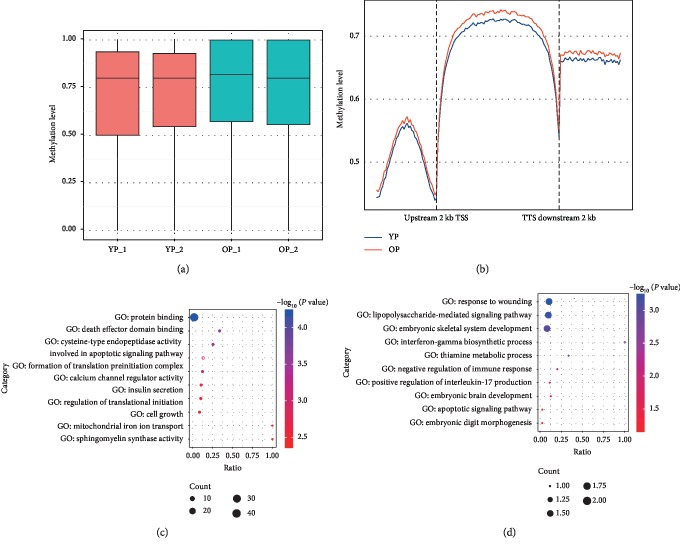
Figure 1.
DNA methylation associated with ovarian aging. (a) DNA methylation levels between both ovarian development stages. YP-1and YP-2 represent sample 1 and sample 2 from young sows at the puberty stage, respectively; OP-1 and OP-2 represent sample 1 and sample 2 from old sows at the reproductive exhaustion stage, respectively. (b) Distribution of CG methylation reads on and around the gene body region. Abbreviations: TSS, transcription start site; TTS, transcription termination site. Gene ontology (GO) function enrichment of the (c) hypermethylated genes and (d) hypomethylated genes related to the different methylation regions (DMRs).

