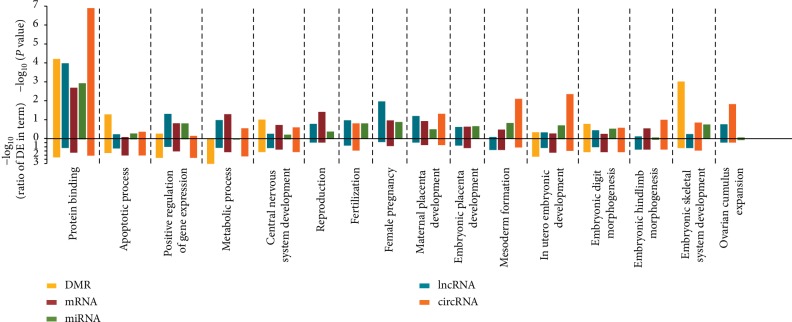
Figure 4.
Overlaps of gene ontology (GO) function enrichment among different DNA methylation regions and different expression RNAs. The top different methylation regions (DMRs) and expressed RNAs (miRNAs, mRNAs, lncRNAs, and circRNAs) were both GO enriched. The x-axis indicates the RNA class and DMR enriched at GO term, the upper half of y-axis indicates the P value of enrichment, and the lower half of y-axis indicates the ratio of differentially expressed and background of GO term.

