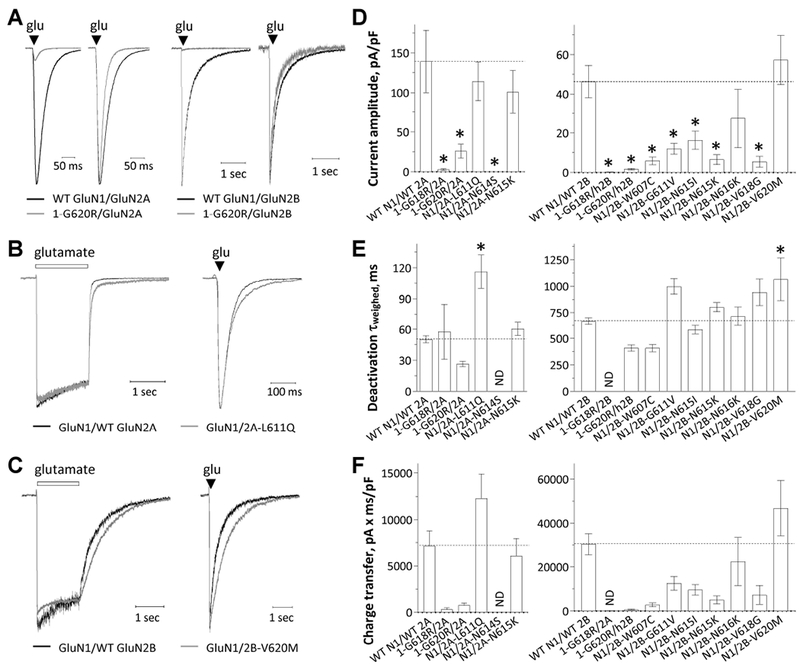
Figure. 5. M2 pore loop variants influence current amplitude and response time course.

(A) Representative current response time courses are shown from a whole cell voltage clamp recording of HEK293 cells (VHOLD −60 mV) expressing GluN1-p.G620R/GluN2A (right: normalized response) or GluN1-p.G620R/GluN2B (right: normalized response) receptors in response to rapid application of brief (5 ms) duration of 1 mM glutamate (50 μM glycine was in all solutions).
(B,C) The representative current response time course from a whole cell voltage clamp recording of GluN1 /GluN2A-p.L611Q (B) and GluN1/GluN2B-p.V620M (C) receptors to rapid application of 1 mM glutamate for prolonged (left, 1.5 sec) and brief duration (right, 5 ms). Responses are shown normalized to the WT response at the moment glutamate was removed. Saturating glycine (50 ¼M) was present in all of solutions.
(D,E,F) Summary of peak amplitudes, weighted deactivation time constant, and charge transfer. *p < 0.05, one-way ANOVA, with Dunnett multiple comparisons. Fitted and statistical parameters are given in Table 5 and Supp. Tables S4, S5, S6.
