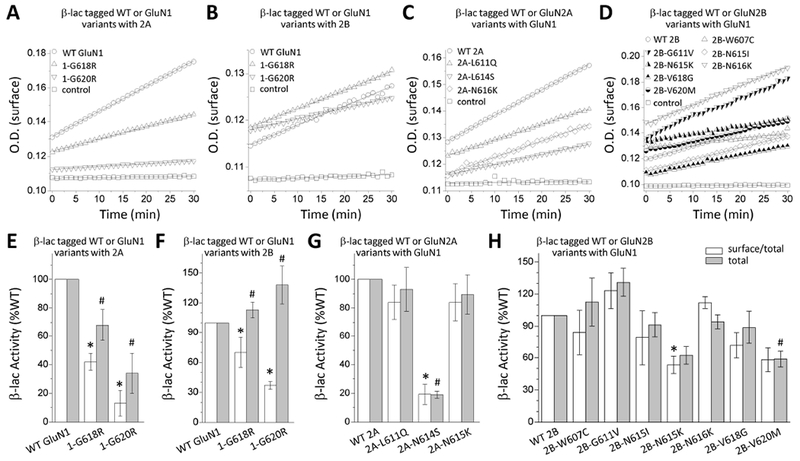
Figure. 8. M2 pore loop variants influence receptor cell surface expression.

(A,B,C,D) Representative plots of nitrocefin absorbance (optical density, O.D.) as a function of time are shown for HEK293 cells expressing WT or M2 pore loop variants β-lac-GluN1 (A,B), β-lac-GluN2A (C), or β-lac-GluN2B (D). β-lac-tagged constructs were present in all conditions except control cells. (E,F,G,H) The slopes of O.D. versus time were averaged (n = 3-10 independent experiments) and graphed as percentages of WT for the ratio of surface/total. Data are expressed as mean ± SEM, and were analyzed by one-way ANOVA with Dunnett’s Multiple Comparison Test compared to WT (*p < 0.05, compared to WT surface/total ratio; #p < 0.05, compared to WT total level). Fitted and statistical parameters are given in Table 5 and Supp. Tables S4, S7, S8.
