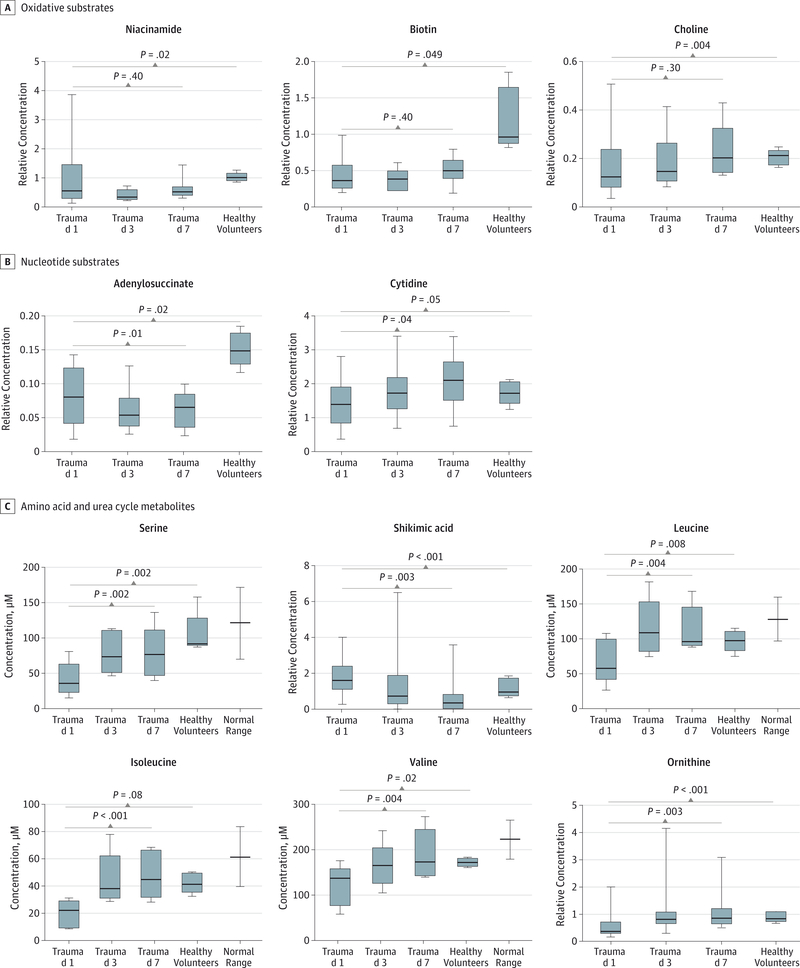
Figure 3. Plasma Concentrations in Blunt Trauma Patients and Healthy Volunteers.
Generated using mass spectrometry-based metabolomics. Box and whisker plots display median, interquartile range, maximum, and minimumvalues. Comparisons between trauma patients and healthy volunteers are based on multiple regression with adjustments for body mass indexand processing batch. Comparisons between day-1 and day-7 trauma patients are based on paired t tests. Multiple testing is accounted for by a Benjamini-Hochberg false discovery rate method.23

