
Figure 7:
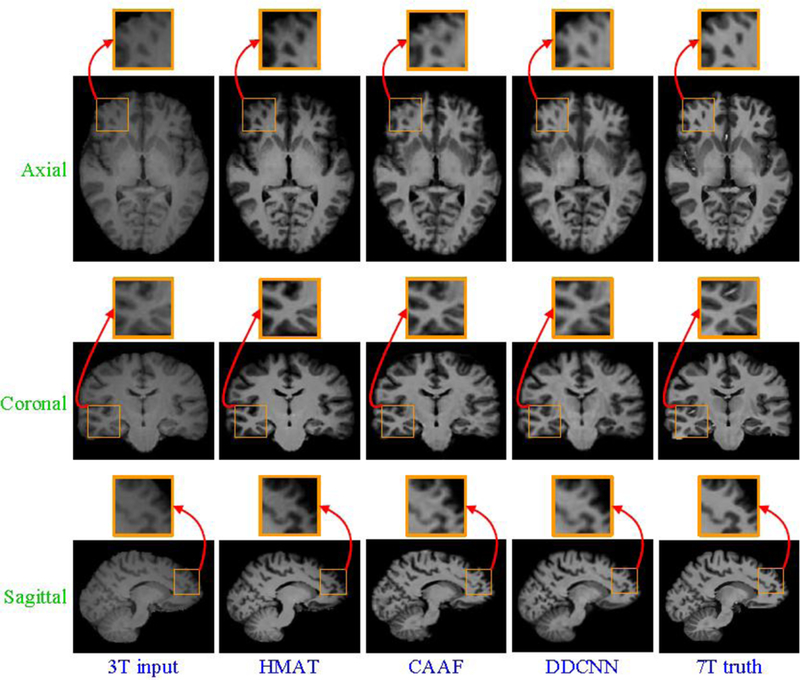
Visual comparison of axial, sagittal and coronal views of synthesized 7T-like images with close-up views of specific regions for one subject. For all methods, SSIM values are as follows: (a) 3T input, (b) HMAT (SSIM=0.3025), (c) CAAF (SSIM=0.8590), (d) DDCNN (SSIM=0.8792), and (e) 7T truth.