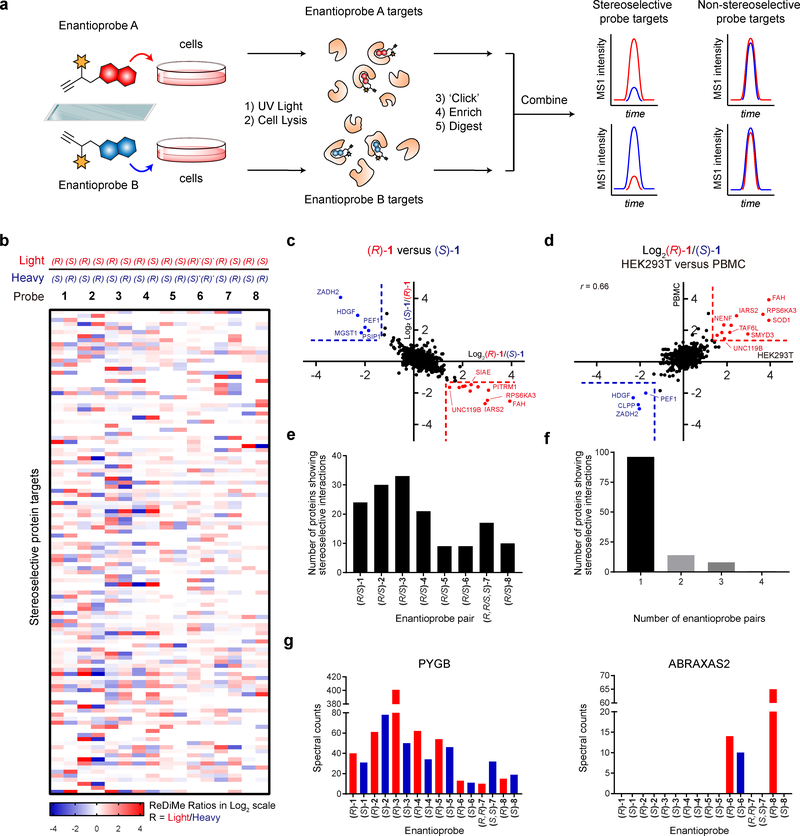
Figure 2. MS-based profiling of enantioprobe-protein interactions in human cells.
a, Schematic workflow for identifying stereoselective enantioprobe-protein interactions in human cells. b, Heatmap showing relative protein enrichment ratios for pairwise comparisons of (R) and (S) enantioprobes (200 μM each) in both isotopic directions in human peripheral blood mononuclear cells (PBMCs). White signals in the heatmap either correspond to proteins with ratio values of ~ 1 or proteins that were not enriched and quantified with the indicated enantioprobe pair. (R)* and (S)*- represent (R,R) and (S,S)- for enantioprobe 7. c, Representative scatter plot showing protein enrichment ratios for (R)-1 versus (S)-1 in PBMCs. Proteins enriched > 2.5-fold by one enantiomer over the other are considered stereoselective targets. Red and blue protein targets show stereoselective interactions with (R)-1 and (S)-1, respectively. Data reflect an average of at least two independently performed experiments for each isotopic direction that provided similar results (see Supplementary Dataset 2). d, Similar stereoselective interactions are observed in different cell types. Plot depicts Log2 values of protein enrichment ratios for (R)-1/(S)-1 in HEK293T cells (x-axis) versus PBMCs (y-axis). The graph contains 812 total quantified proteins. r values are Pearson correlation coefficients. Data reflect an average of two independently performed experiments that provided similar results (see Supplementary Dataset 2). e, Number of stereoselective protein interactions found for each enantioprobe pair in PBMCs. f, Number of proteins showing stereoselective interactions with the indicated number of enantioprobe pairs in PBMCs. g, Quantity of aggregate spectral counts for PYGB (left graph) and ABRAXAS2 (right graph) enriched by each enantioprobe in PBMCs.

