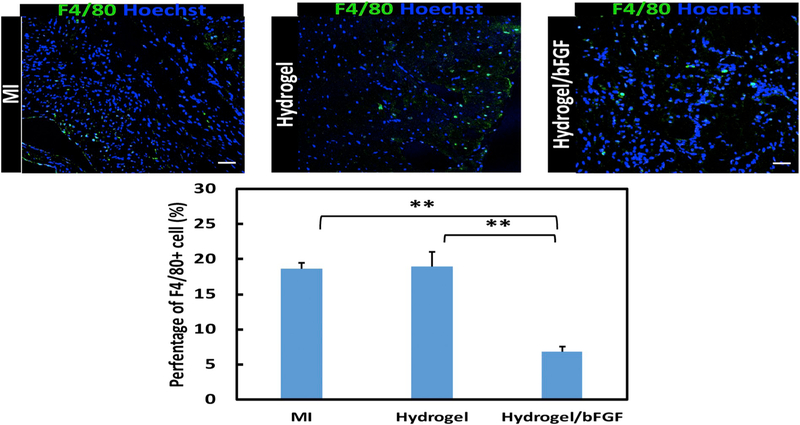
Fig. 11.
F4/80 staining of the infarcted region after 4 weeks of injection. Scale bar = 100 μm. Inflammatory cells are identified by F4/80(Green) positive cells from images for MI, Hydrogel, and Hydrogel/bFGF groups. **p < .01. (For interpretation of the references to colour in this figure legend, the reader is referred to the web version of this article.)

