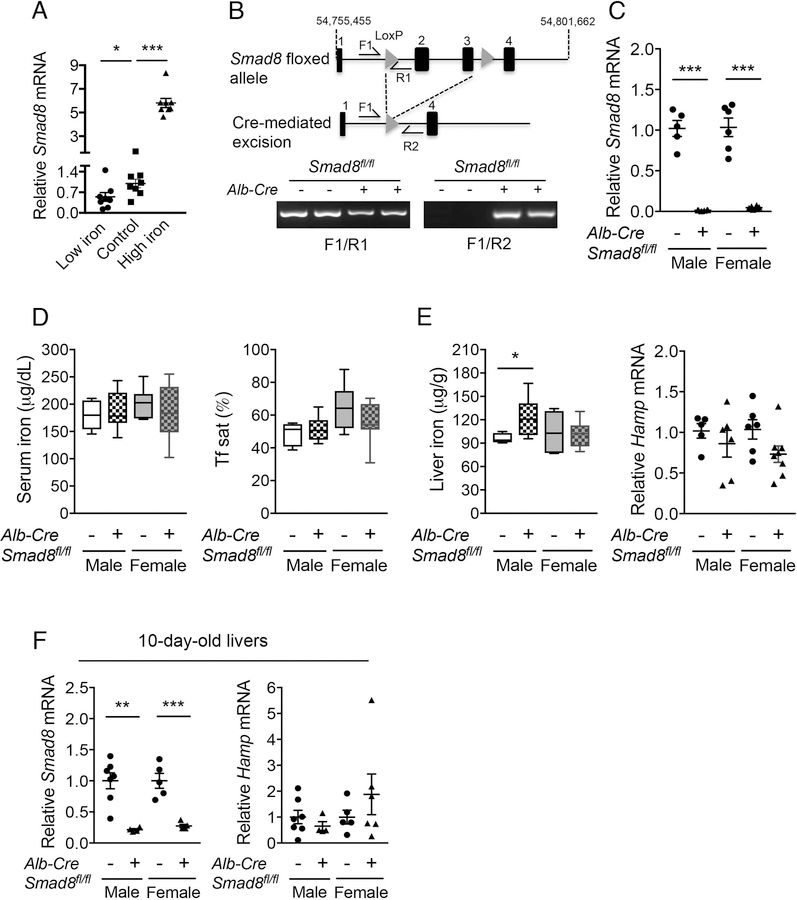
Fig. 1. Iron regulates liver Smad8 expression, but hepatocyte Smad8 conditional knockout mice (Smad8fl/fl;Alb-Cre+) exhibit minimal to no iron loading.
(A) Relative Smad8 expression was measured by qRT-PCR in livers of 7-week-old C57BL/6 male mice after receiving a low (2–6 ppm), sufficient (48 ppm; Control) or high iron (2% carbonyl) diet for 3 weeks (n= 8 per group). (B, top) Schematic depictions of the lox-P-flanked (floxed) Smad8 allele and the allele after Cre recombinase-mediated excision. F and R indicate forward and reverse primers used for PCR genotyping. (B, bottom) PCR analysis of genomic DNA extracted from total liver of Smad8fl/fl;Alb-Cre+ mice and littermate Cre- controls at 8 weeks of age. (C) Relative Smad8 mRNA levels in the total livers of Smad8fl/fl;Alb-Cre+ mice and littermate Cre- controls was measured by qRT-PCR to confirm hepatocyte Smad8 ablation in conditional knockout mice (n= 5–8 per group). (D) Serum iron (left), transferrin saturation (Tf sat, right), (E) hepatic nonheme iron concentrations (left) and liver hepcidin (Hamp) expression (right) were quantified in 8-week-old male and female Smad8fl/fl;Alb-Cre+ mice compared with their respective littermate Cre- controls (n= 5–8 per group). (F) Liver Smad8 and Hamp mRNA were measured by qRT-PCR in male and female Smad8fl/fl;Alb-Cre+ mice and littermate Cre- controls at 10 days of age (n=4–7 per group). All transcript levels were normalized to Rpl19, and the average of the respective littermate Cre- control mice was set to 1. Data are presented as scatter plots with mean ± SEM or box plots with min to max whiskers. *P < 0.05, **P < 0.01, ***P < 0.001 relative to mice fed an iron sufficient diet by one-way ANOVA with Tukey’s post hoc test or to the respective Cre- controls by Student’s t test.

