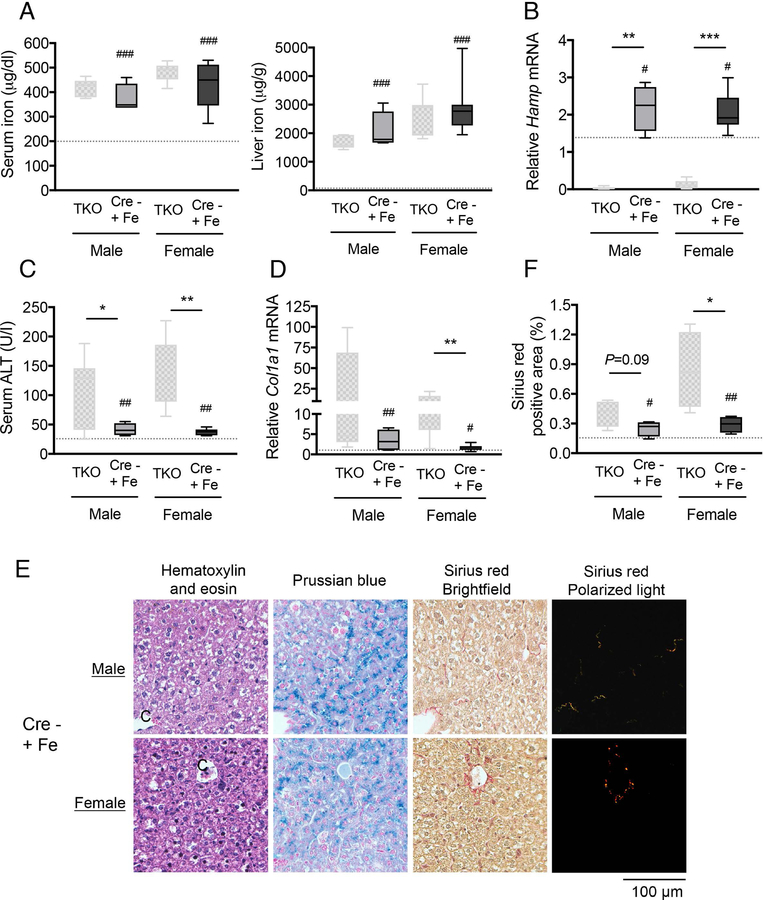
Fig. 8. Hepatocyte ablation of Smad1/5/8 worsens iron-induced liver injury and fibrosis in mice.
Three-week-old male and female Smad15;Alb-Cre- mice were fed a high iron (2% carbonyl iron) diet for 5 weeks (Cre- +Fe, n=4–8 per group). At 8 weeks of age, tissues were collected to measure (A) serum iron and liver iron and (C) serum ALT. (B) Liver Hamp and (D) Col1a1 relative to Rpl19 mRNA levels were measured by qRT-PCR. Data are presented as box plots with min to max whiskers. Results from Smad158;Alb-Cre+ mice on a house diet from Figure 2 and Figure 6 were replotted for comparison (TKO). The dotted lines represent the average of all Cre- mice on a house diet from Figure 2 and 6 for reference. For qRT-PCR, results are normalized to the average of male Smad158;Alb-Cre- control mice on a house diet, which was set to 1. #P < 0.05, ##P < 0.01, ###P < 0.001 relative to Cre- mice on a house diet by Student’s t test. *P < 0.05, **P < 0.01, ***P < 0.001 relative to sex-matched TKO mice by Student’s t test. (E) In a subset of mice (n=4 per group), liver sections were stained with hematoxylin and eosin, picrosirius red for collagen formation, or Perls’ Prussian blue for tissue iron. Images were taken under the brightfield and/or polarized light, and representative images are shown. (F) The sirius red positive area was quantitated by dividing total area calculated in polarized light (after subtraction of major veins) by total area calculated under the brightfield (n=4 per group). Data in panel F are presented and analyzed as in panels A-D.

