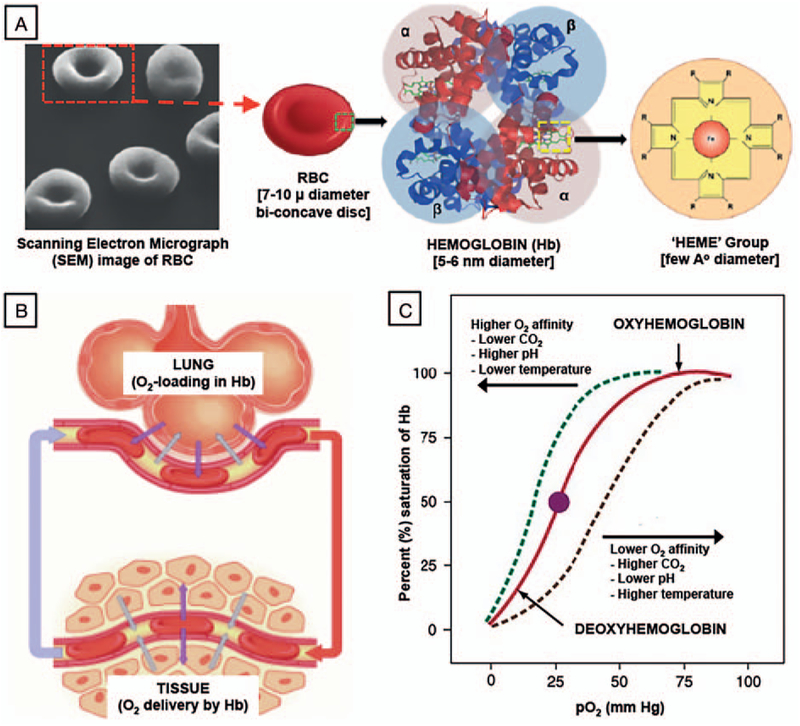
Fig. 1. A, Multiscale representation of RBCs and hemoglobin (Hb), showing a scanning electron micrograph (SEM) image of RBC depicting the biconcave discoid structure, along with sequential schematic of RBC structure, Hb structure, and “Heme” structure.
B, It shows a schematic of RBC movement between lung (oxygen loading site) and tissue (oxygen off-loading site), while (C) shows corresponding oxygen equilibrium curve (OEC) characteristics of Hb. RBCs indicates red blood cells.

