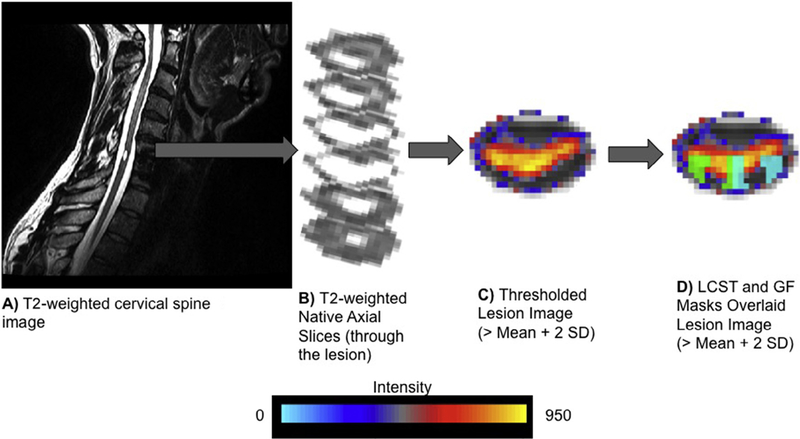
Fig. 2.
(A) A native sagittal T2-weighted image of a participant with spinal cord injury. (B) Native axial T2-weighted images through the spinal cord lesion. (C) The lesion filled image was then straightened along the spinal cord and registered to the MNI-Poly-AMU spinal cord template. The mean and standard deviation (SD) of the voxel intensities were then calculated within a non-lesioned 1-cm axial cross section of the spinal cord immediately superior to the lesion. The maximum intensity projection image was then thresholded at two SDs above the mean to define the lesion. (D) The extent of spinal cord damage was then quantified in the axial plane as the ratio of the spinal cord that was lesioned across the total cord and within the right and left lateral corticospinal tracts (LCST) and gracile fasciculi (GF). One representative participant is shown. The right and left LCST and GF are shown in green and light blue, respectively.

