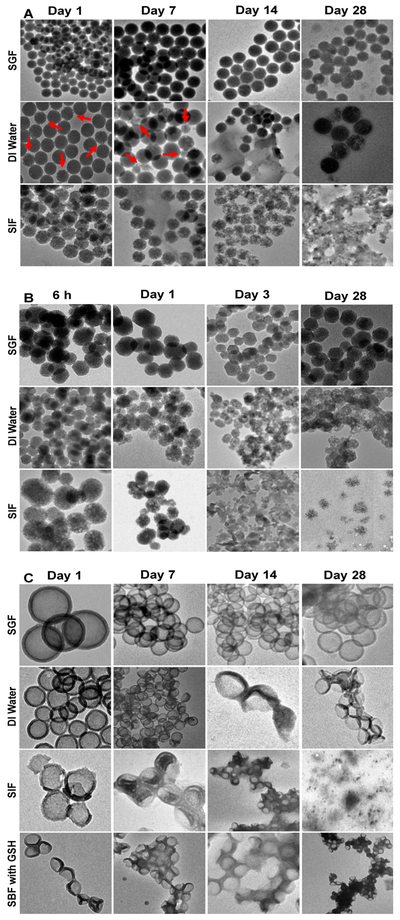
Figure 4.

Degradation images of the nanoparticles taken by TEM after immersion in SGF, DI water, and SIF over 28 days (from left to right). A: Stöber 100, B: Meso 100, and C: Disulfide Hollow 100 nanoparticles. The latter was also investigated in SBF with 10 mM of GSH. Stöber 100 nanoparticles underwent surface degradation while Meso 100 nanoparticles underwent surface and bulk degradation. Disulfide Hollow 100 particles tend to collapse or rupture and disintegrate into smaller fragments. Images are in accordance with the observed degradation results with this order for all the particles: SIF>DI water>SGF (> means quicker degradation). Since the fabricated nanoparticles behave differently in simulated dissolution media and some particles like Meso 100 degraded much faster than their counterparts, the time points indicated in this figure are specific to each nanoparticle.
