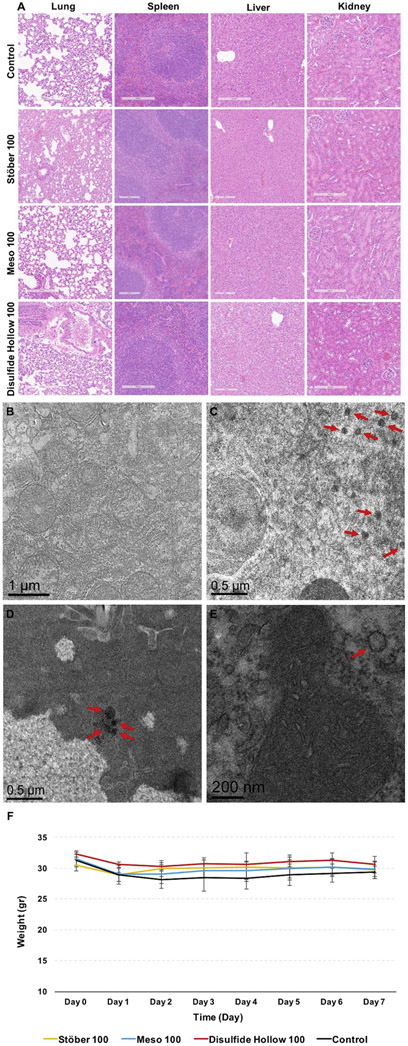
Figure 7.
A: Light microscopy analysis for representative sections of liver, spleen, lung, and kidney obtained from control and nanoparticle treated groups after 7 days post-injection at the dose of 25 mg kg−1. The slides were H&E stained. As illustrated, no toxicity, including lymphocytic infiltration, inflammation, necrosis, and degeneration of the tissues, was observed. TEM images of the particles taken up by the liver tissues treated with B: 0.9% normal saline (control group), C: Stöber 100, D: Meso 100, and E: Disulfide Hollow 100 nanoparticles. As demonstrated, nanoparticles are entrapped by liver cells as a group of particles (Meso 100) or as a single particle (Stöber 100 and Disulfide Hollow 100). F: Animal growth chart measured daily. No significant body weight changes were observed in control and nanoparticle treated groups. Mice growth data are mean ± SD (N=3).

