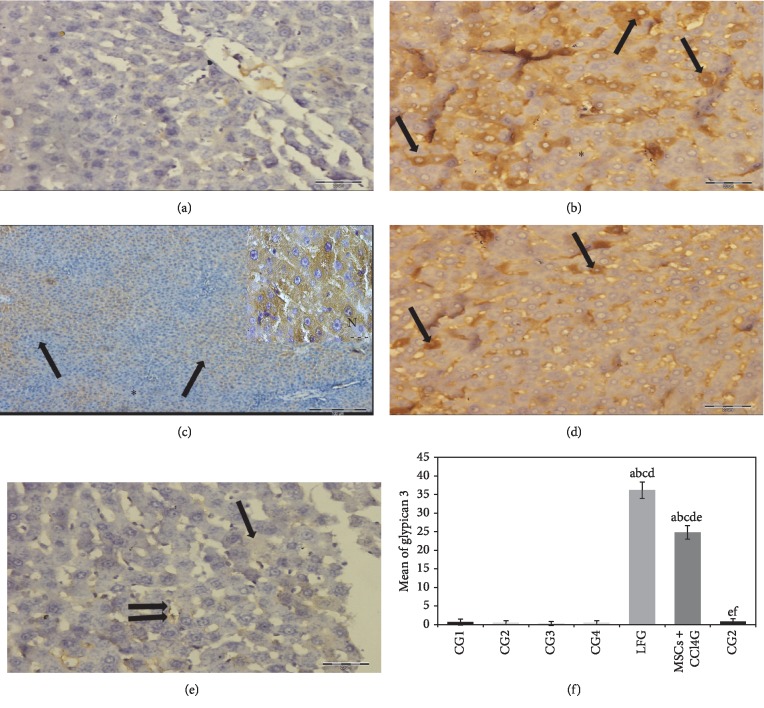
Figure 7.
(a–e) Rat liver stained with anti-glypican 3 primary antibody. (a) CG demonstrating negative reaction (mic. mag.: 400×). (b, c) LFG shows positive brownish reaction scattered in many foci of hepatic lobules (arrows) while other areas show negative reaction (black asterisk) (mic. mag.: (b) 400×; (c) 100×). Inset in (c) is an oil emersion high power of hepatocytes depicting the cytoplasmic brown granular deposits of glypican 3 (white asterisk). Note that the nuclei of hepatocytes are devoid of brown deposits (N) (mic. mag.: 1000×). (d) MSCs transplanted into rat liver with continuous CCl4 exposure (MSCs + CCl4) demonstrating evident reduction in hepatocytes with positive brown cytoplasmic deposits (arrows) compared to (b) (mic. mag.: 400×). (e) MSCs transplanted into rat liver after cessation of CCl4 exposure (MSCsG) depicting faint positive reaction in individual hepatocyte (arrow) and in the lining of hepatic sinusoids (double arrow) (mic. mag.: 400×) (immunohistochemistry anti-glypican 3 antibody, DAB chromogen, and hematoxylin counterstain). (e) A morphometric study for the number of positive cells for anti-human glypican 3. Values represent mean ± SD. Different letters indicate significant statistical differences at (p ≤ 0.05). aSignificant compared with CG1. bSignificant compared with CG2. cSignificant compared with CG3. dSignificant compared with CG4. eSignificant compared with LFG. fSignificant compared with MSCs + CCl4G. It revealed that CCl4 treatment led to significant increase in the number of positive cells which was reduced following BM-MSCs treatment.

