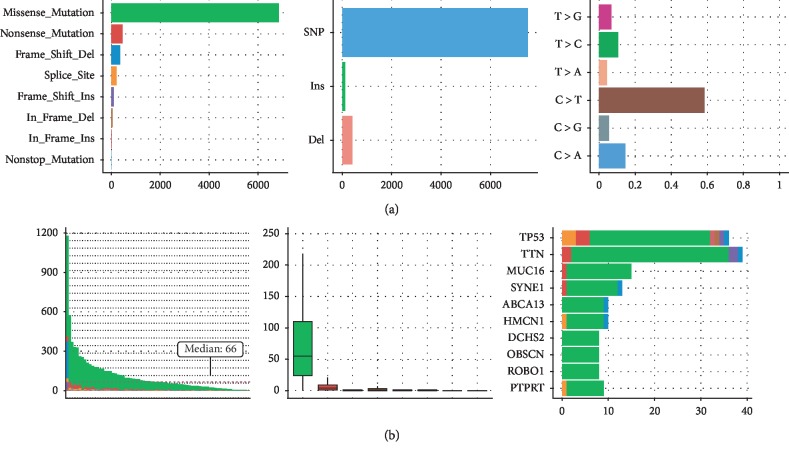
Figure 1.
Mutation landscape in Fujian cohort. (a) From left to right, counts of each variant classification, counts of each variant type, and counts of each SNV class are presented. (b) From left to right, variants number per sample, variant classification, and top 10 significantly mutated genes are presented.

