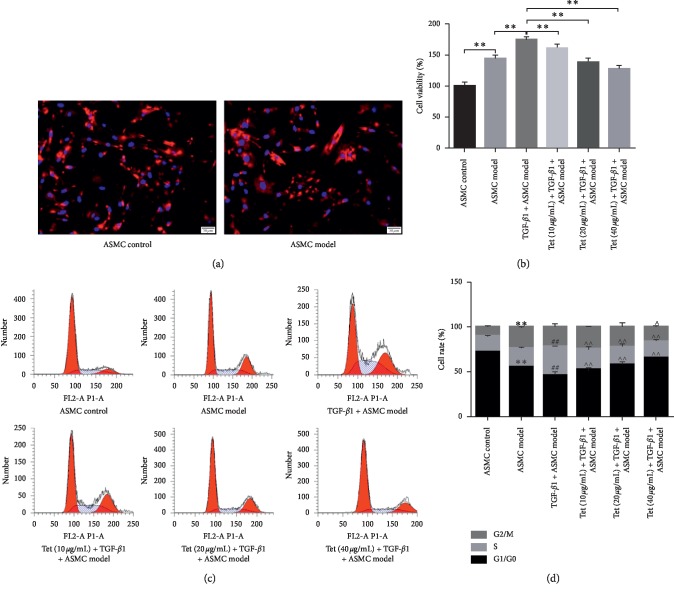
Figure 2.
Effects of Tetrandrine on primary ASMCs proliferation. (a) Verification of primary ASMCs measured by IF assay. Red: α-actin; blue: DAPI. Scale bar: 50 μm. (b) Cell viability of different group cells analyzed by CCK8 experiment. (c) Cell cycle of different evaluated by flow cytometry. (d) The percentage distribution of cells in each cell cycle phase after different treatment. Data represent the mean ± SD of three experiments, each performed in triplicate. ∗∗, ##, ∧∧p < 0.01.

