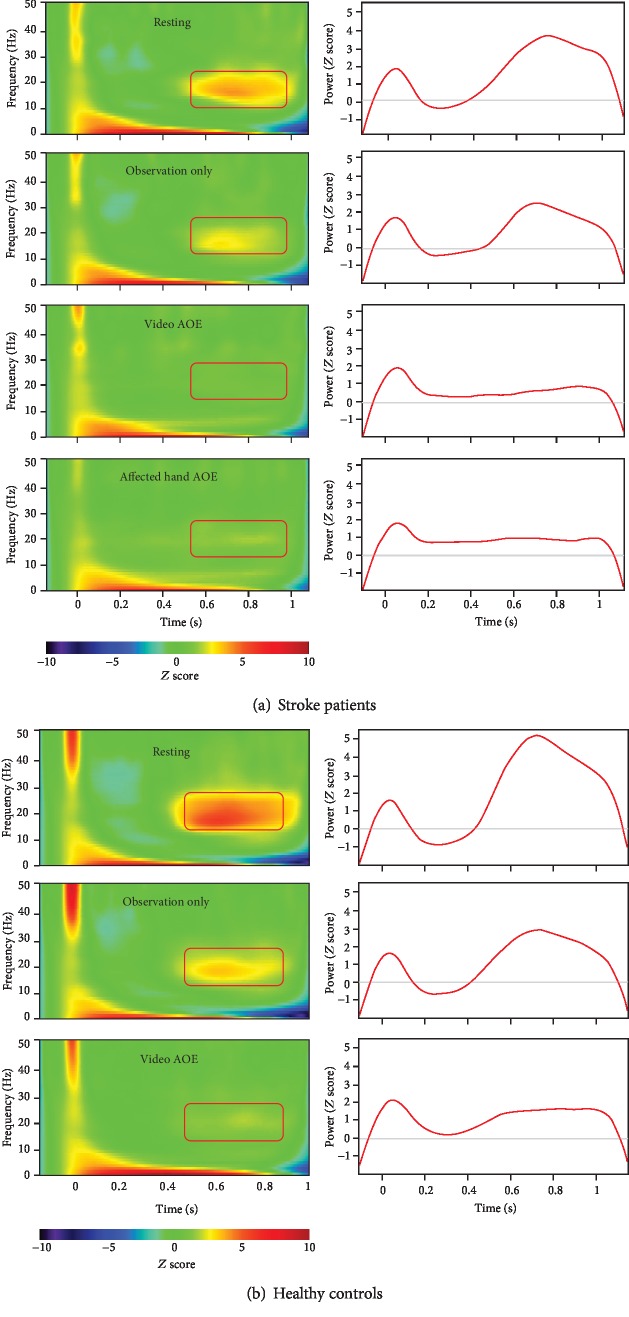
Figure 3.
Left panel of (a, b): time-frequency maps of group-averaged electricity-induced beta rebound oscillations (red rectangles) under each condition. Right panel of (a, b): time courses of beta oscillatory activities in the most reactive frequency bands (2 Hz for consecutive bins) in the primary motor cortex (M1). Note: AOE = action observation and execution.

