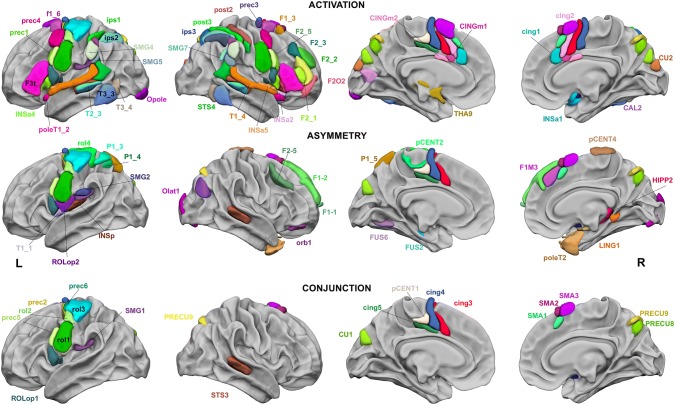
Fig. 2.
Regions of the AICHA atlas significantly activated in the three tasks (top row), significantly asymmetrical in the three tasks (middle row), and significantly conjointly activated and conjointly asymmetrical in the three tasks (bottom row). The hROIs are projected on the white matter surface of the BIL&GIN template with Surf Ice (https://www.nitrc.org/projects/surfice/) software. Leftward asymmetrical hROIs, as well as conjointly leftward activated and conjointly asymmetrical hROIs, are presented on the left hemisphere, and rightward asymmetrical hROIs are presented on the right hemisphere. The hROIs considered activated or asymmetrical per hemisphere by task were selected according to a p value < 0.05; the statistical threshold applied to the conjunction of asymmetry and activation for a given task was p < 0.0025 for each hemisphere, and the threshold set for the three-task conjunction was p < 6.25 × 10⁻⁶

