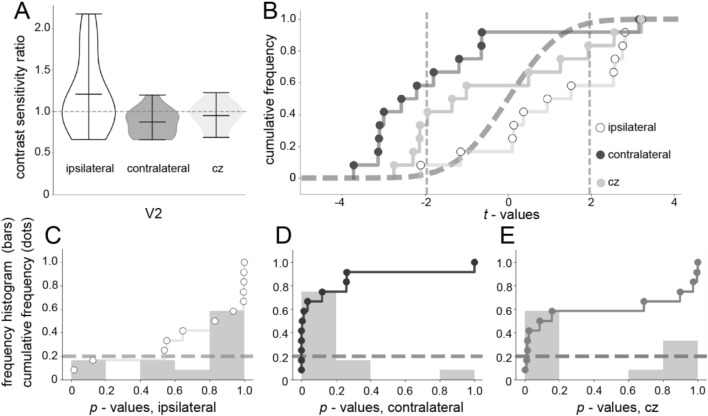
Fig. 1.
Behavioral results of the contrast sensitivity task. a Violin plots of the contrast sensitivity ratios between behavioral and stimulation session (n = 12 hemifield V2). Ratios were obtained as (pre-TMS thresholds/post-TMS threshold) for the contralateral (stimulated) and ipsilateral (non-stimulated) hemifield for the two V2 stimulation conditions, while for CZ, the ratio was obtained averaging contrast thresholds of the two hemifields. Horizontal central lines within each violin represent the mean of the CRS. Violin in white represents the CRS of the visual field ipsilateral respect to the TMS-stimulated one, while gray violin represents the contralateral. Dotted horizontal gray line indicates the 1:1 ratio. b Empirical cumulative distribution functions for the contrast sensitivity z-scores obtained across the 12 hemispheres for the comparisons between the visual field ipsilateral to the TMS stimulation (white), visual field contralateral to the TMS stimulation (dark gray), and control CZ (light gray). The dashed curve is the theoretical “chance” distribution (cumulative Gaussian with mean = 0 and sigma = 1). The two dotted vertical lines (z-scores of ± 1.96) define the regions of statistically significant differences (p < 0.05, two tailed) at the level of the individual participants. c Empirical cumulative distribution functions for the related contrast sensitivity test p values for the contralateral comparison. The histograms in the background have been obtained by grouping the p values in bins of 0.2 between 0 and 1. The gray and white areas indicate, respectively, the nonsignificant and significant p values (p < 0.05, two tailed) at the level of the individual participants. The dashed horizontal gray line represents the predicted uniform “chance” distribution of p values. d Same as (c) for the ipsilateral comparison. e Same as (c) for the control area CZ

