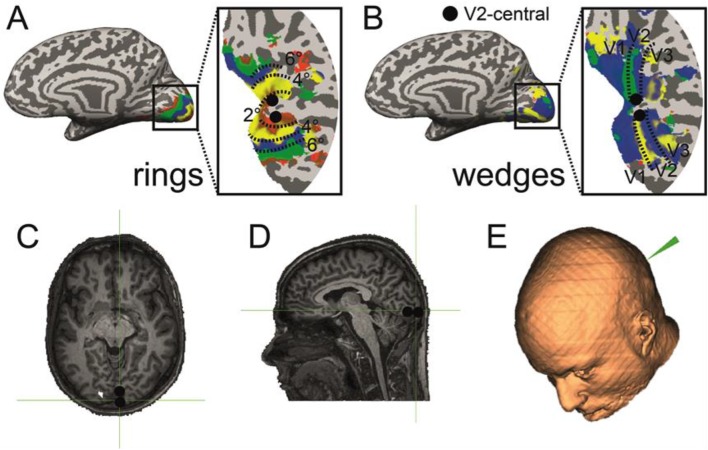
Fig. 3.
Retinotopic localization of the stimulated area. a Surface map of the right hemisphere of one participant showing the retinotopic maps obtained from the presentation of expanding/contracting rings. b Surface map of the same participants showing the retinotopic map obtained from the clockwise/anticlockwise wedges. The dorsal and ventral central spots of V2 identified with the maps are marked with a black circle. c Coronal view of the anatomical image of the participant with the 3D projection of the delimited V2 area. d Sagittal view of the same 3D projection. e 3D head reconstruction in the neuronavigation system and positioning of the TMS-stimulated spot corresponding to central V2. It can be observed that the cortical distance between left and right hemispheres is enough to discard any possible contamination due to the diffusion of the TMS pulse

