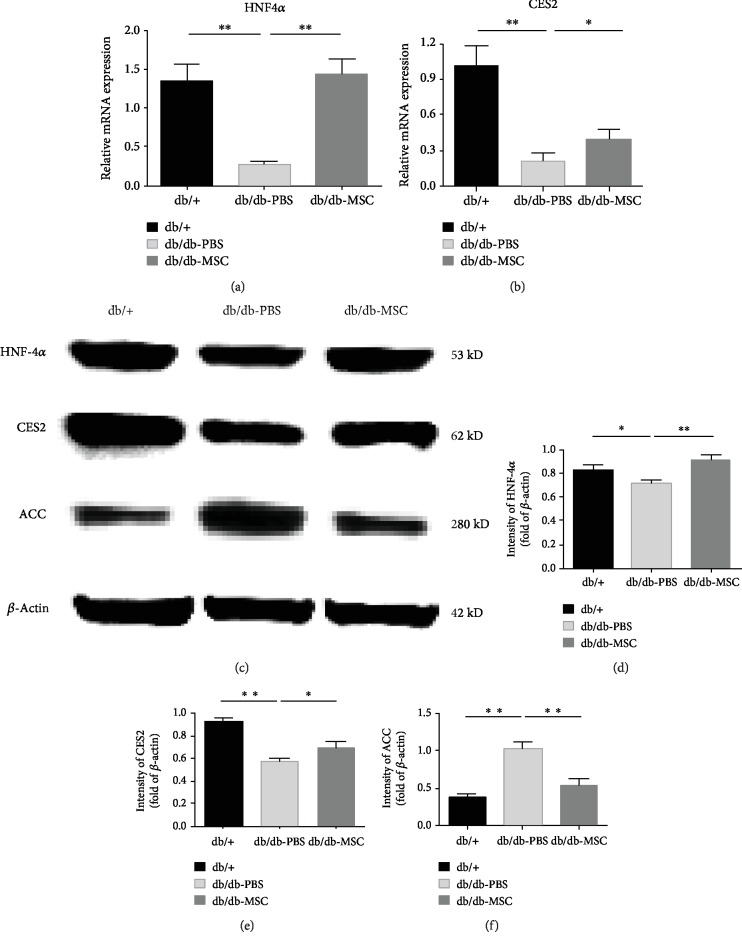
Figure 6.
Human UC-MSC infusions upregulated the HNF4α and CES2 expressions. Transcript levels of HNF4α (a) and CES2 (b) in the livers of the indicated groups assessed by qRT-PCR. (c) Protein levels of HNF4α, CES2, and ACC assessed by western blot (β-actin served as the loading control). (d–f) Statistical analysis of HNF4α, CES2, and ACC protein levels. Each experiment was repeated three times, and typical pictures were shown. Data are expressed as means ± SD. ∗p < 0.05; ∗∗p < 0.01.

