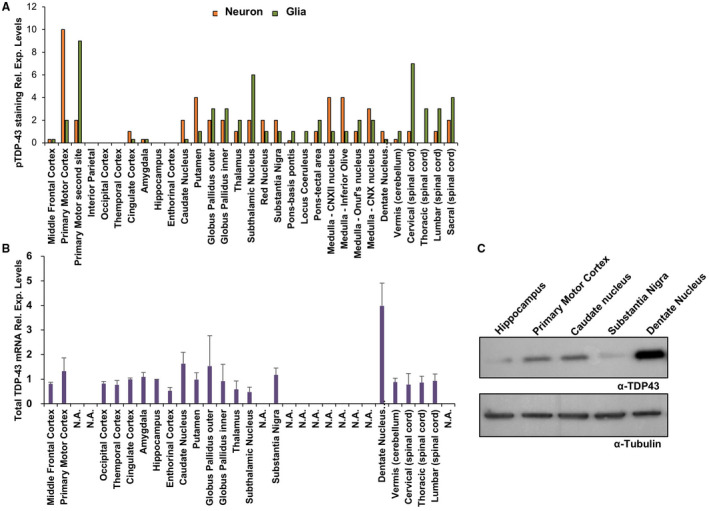
Figure 3.

Comparison of TDP‐43 and pTDP‐43 expression patterns in the S375G patient brain. A. Levels of pTDP‐43 expression in the neurons and glia of different brain regions. After a low power scan, three noncontiguous microscopic fields were examined at 40x magnification using an Olympus BX41 brightfield microscope and averaged for the count. A nucleus had to be recognized for the count. B. Total TDP‐43 mRNA expression in different brain regions of ALS S375G patient as measured by RT‐qPCR. Three independent experiments were analyzed and both relative expression and standard deviations are shown for each region. The brain regions that were not available in sufficient amounts for RNA extraction are reported as not available (N.A.). C. Western blot analysis of patient samples that were in sufficient quantity to extract proteins. The expression levels of total TDP‐43 were determined using the Proteintech antibody. Tubulin was used as a loading control.
