Figure 8.

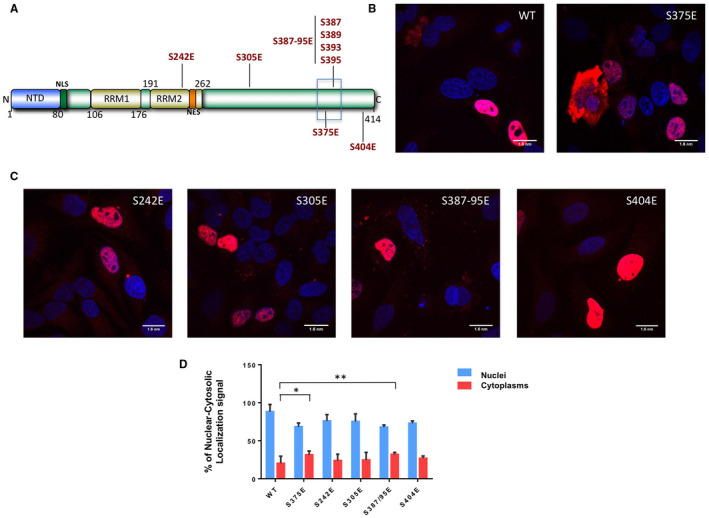
Intracellular localization of TDP‐43 mutants. A. Schematic diagram of wild‐type TDP‐43 showing the nuclear localization signal (NLS), nuclear export signal (NES), RNA Recognition Motifs (RRMs) and the phosphomimic mutations introduced in the various potential phosphorylation sites at positions S242, S305, S375, S387–389–393–395 and S404. B–C. Immunofluorescence of transiently transfected WT Flag‐TDP‐43 and S242E, S305E, S375E, S387E–389E–393E–395E (S387–395E) and S404E flag‐tagged TDP‐43 mutants in HeLa cells. The overexpressed proteins were visualized using anti‐Flag polyclonal antibody in a 100 nm/pixel field. Scale bar = 10 μm. D. Shows a quantification of nuclear‐cytoplasmic staining intensity for all these mutants. Statistical analysis was performed using multiple comparison 1‐way Anova test with Bonferroni's correction (*P < 0.05; **P < 0.001).
