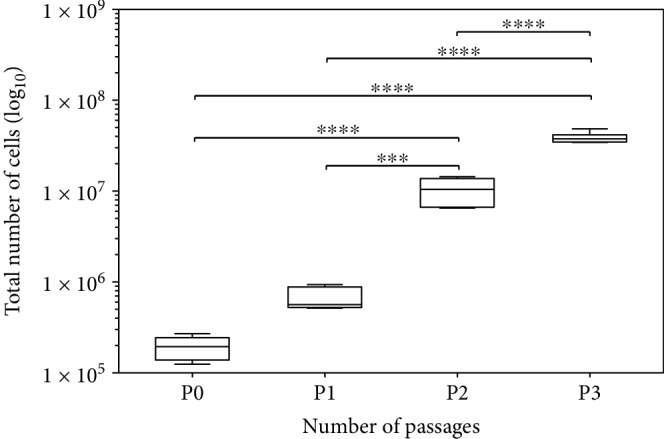
Figure 2.

Total number of cells within the neurosphere cultures continuously increased significantly via passages P0-P3. Box plots show the median with the upper and lower quartiles, whiskers mark the upper and lower maximum values, and asterisks indicate the level of significance: ∗p < 0.05, ∗∗p < 0.005, ∗∗∗p < 0.001, and ∗∗∗∗p < 0.0001.
