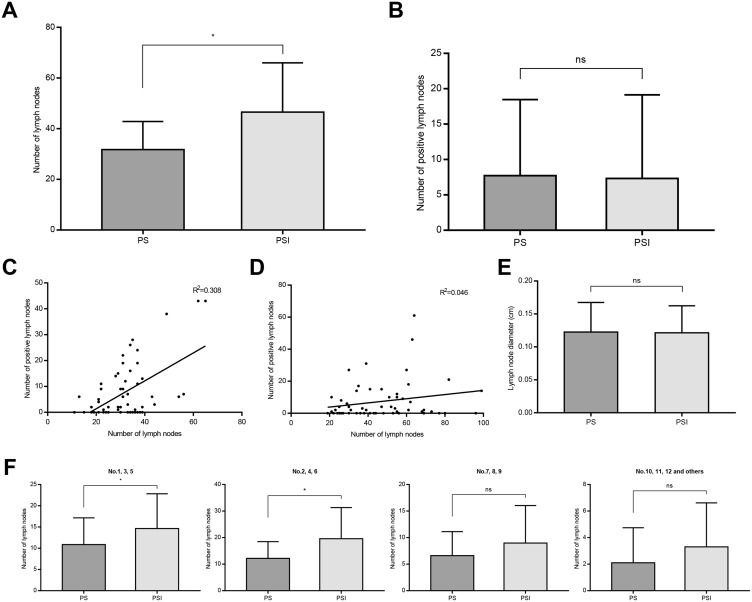
Figure 3.
Lymph nodes harvested in PS and PSI groups. (A and B) Average number of lymph nodes harvested in PS and PSI groups (*P<0.05). (C and D) Correlation between the number of lymph node harvested and positive lymph node harvested in PS and PSI groups. (E) The minimum average lymph node diameter in PS and PSI groups. (F) Average number of lymph nodes harvested from different lymph node stations (*P<0.05).

