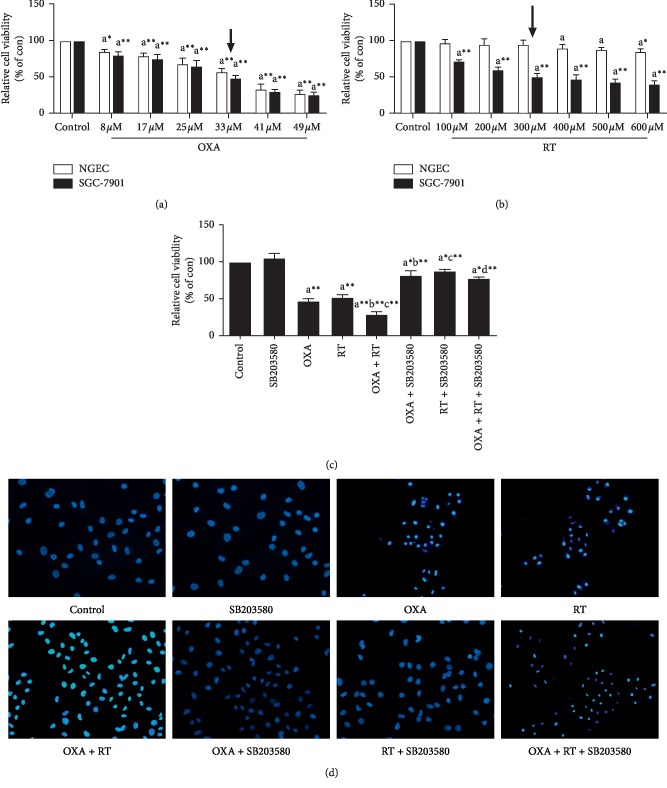
Figure 1.
Effects of different drugs on cells. ap < 0.05, a∗p < 0.01, a∗∗p < 0.001, compared with control group; bp < 0.05, b∗p < 0.01, b∗∗p < 0.001, compared with OXA group; cp < 0.05, c∗p < 0.01, c∗∗p < 0.001, compared with RT group; dp < 0.05, d∗p < 0.01, d∗∗p < 0.001, compared with combination of OXA and RT. Control: SGC-7901/NGEC; SB203580 : 15 nM; RT: 300 μM; OXA:33 μM; RT + OXA: (300 μM + 33 μM); RT + SB203580 (300 μM + 15 nM); RT + OXA + SB203580: (300 μM + 33 μM+15 nM). (a, b) Effect of different concentrations of RT and OXA on the toxicity of NGEC cells and the viability of SGC-7901 cells by MTT (, n = 6). (c) Effects of p38 inhibitor, RT, OXA, and drug combination on SGC-7901 cells proliferation assessed by MTT ( ± S, n = 6). (d) Morphological observation of SGC-7901 cells (Hoechst33258, ×200).

