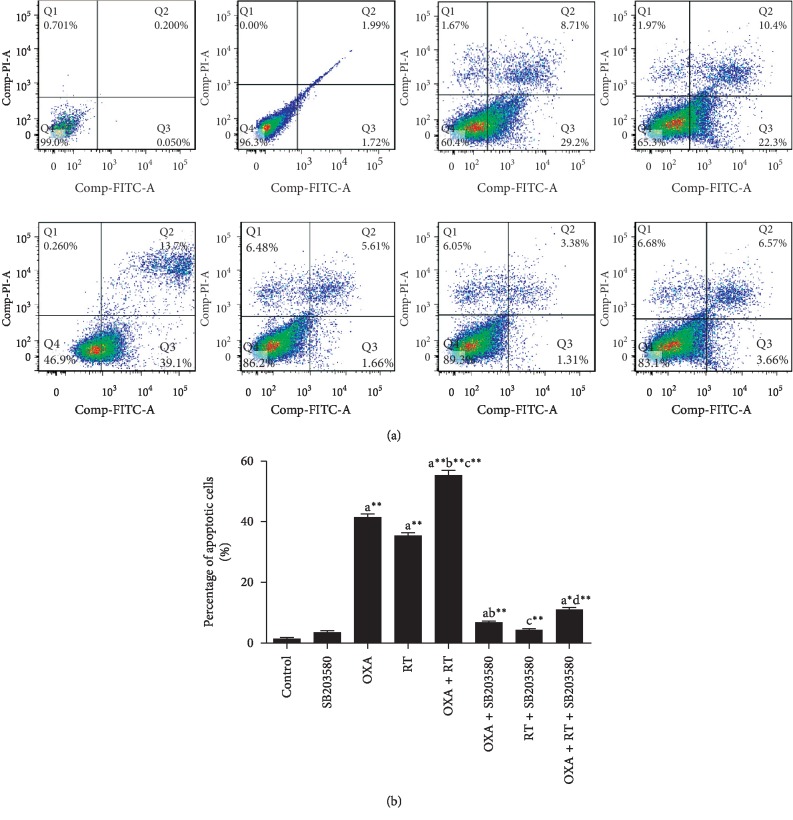
Figure 3.
Effect of different drugs on gastric cancer cell apoptosis assessed by FCM (, n = 3). ap < 0.05, a∗p < 0.01, a∗∗p < 0.001, compared with control group; bp < 0.05, b∗p < 0.01, b∗∗p < 0.001, compared with OXA group; cp < 0.05, c∗p < 0.01, c∗∗p < 0.001, compared with RT group; dp < 0.05, d∗p < 0.01, d∗∗p < 0.001, compared with combination of OXA and RT.

