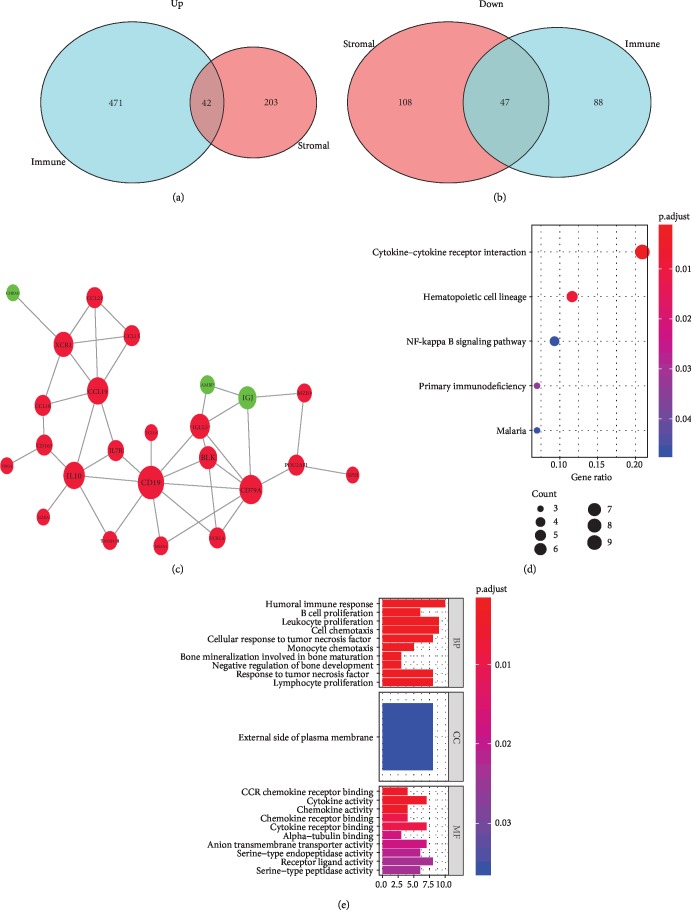
Figure 3.
Analysis of DEGs. (a) 42 upregulated overlapping DEGs and (b) 47 downregulated overlapping DEGs. (c) Protein-protein interaction (PPI) network with confidence >0.7. Red and green nodes represent upregulated and downregulated genes, respectively. (d) The enriched pathways with P < 0.05. (e) The enriched GO terms with P < 0.05 and gene count >5.

