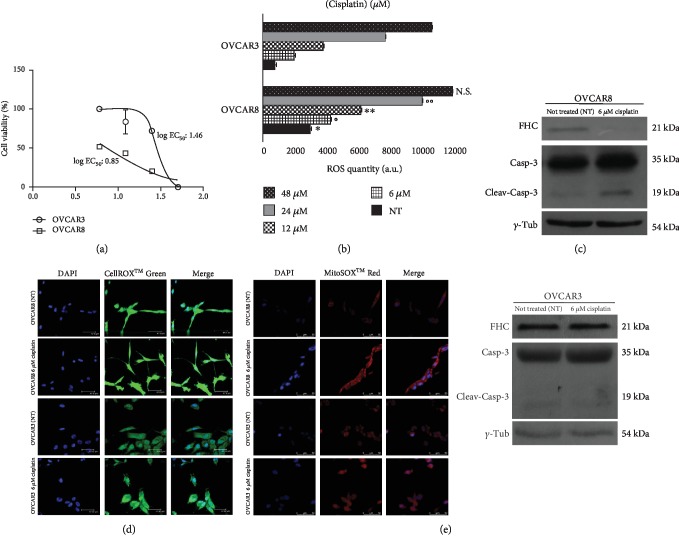
Figure 3.
OVCAR8 cells are characterized by ROS accumulation and FHC downregulation upon 6 μM cisplatin treatment. (a) Cell viability assay performed by MTT analysis in OVCAR3 and OVCAR8 cells treated with 6 μM, 12 μM, 24 μM and 48 μM of cisplatin for 24 h. Cisplatin concentrations are reported as log [cisplatin (μM)]. Cell viability is expressed as percentage (%). Treatments were performed at least three times on independent biological replicates and the mean concentration of the drug that gives half-maximal response (log EC50) was used to compare cytotoxicity. (b) Quantification of ROS amounts through DCFDA staining in OVCAR3 and OVCAR8 untreated (NT) and upon treatment with 6 μM, 12 μM, 24 μM and 48 μM cisplatin for 24 h. Data represent the mean ± SD of three biological replicates. ∗p value < 0.01 OVCAR3 NT vs. OVCAR8 NT; °p value < 0.01 OVCAR3 6 μM cisplatin vs. OVCAR8 6 μM cisplatin; ∗∗p value < 0.05 OVCAR3 12 μM cisplatin vs. OVCAR8 12 μM cisplatin; °°p value < 0.05 OVCAR3 24 μM cisplatin vs. OVCAR8 24 μM cisplatin; N.S.: not significant: OVCAR3 48 μM cisplatin vs. OVCAR8 48 μM cisplatin. (c) Representative western blot of FHC, cleaved caspase 3, and caspase 3 in OVCAR3 and OVCAR8 untreated (NT) and upon treatment with 6 μM cisplatin for 24h. γ-Tub was used as internal control. WB analysis was performed three times and results were reproducible. (d) Immunofluorescence analysis of ROS levels in untreated (NT) and treated with 6 μM cisplatin OVCAR3 and OVCAR8 cells by staining with CellROX® Green Reagent (green). Nuclei were stained with DAPI (blue). Analysis was performed in duplicate and representative images are reported. (e) Immunofluorescence analysis of superoxide radical levels untreated (NT) and treated with 6 μM cisplatin OVCAR3 and OVCAR8 cells by staining with MitoSOX™ Red Indicator (red). Nuclei were stained with DAPI (blue). Analysis was performed in duplicate and representative images are reported.

