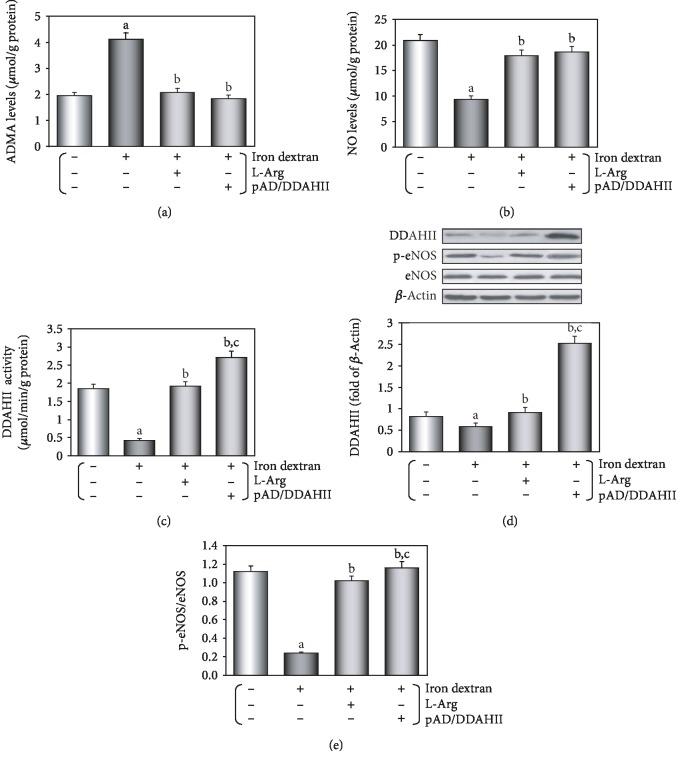
Figure 3.
Changes of the ADMA/DDAHII/eNOS/NO signaling pathway in serum and aortic tissue homogenate of iron overload mice. (a) Serum content of ADMA. (b) Serum content of NO. (c) DDAHII expression in aortic tissue. (d) DDAHII activity in aortic tissue. (e) Phosphorylation of eNOS in aortic tissue. (c, e) From left to right: lane 1: control; lane 2: iron; lane 3: iron+L-Arg; lane 4: iron+pAD/DDAHII. Data are presented as the mean ± SEM for ten individual experiments. aP < 0.01 vs. control group; bP < 0.01 vs. iron overload group; cP < 0.01 vs. iron overload+L-Arg group.

