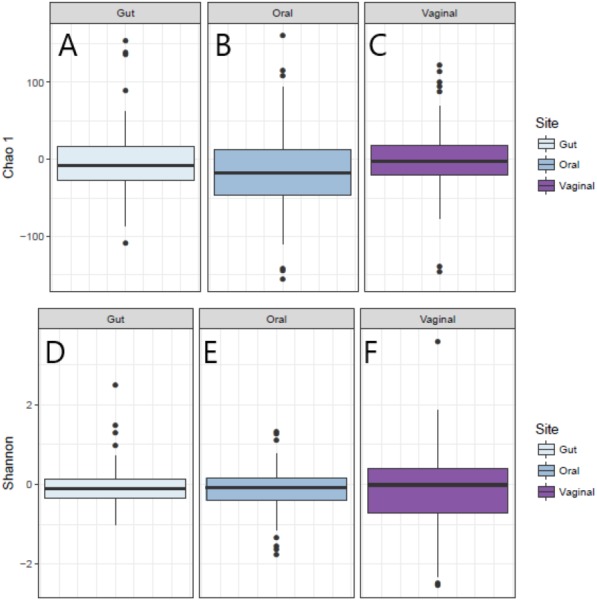
Figure 1. Change in Shannon and Chao1 measures for Visit 1 and Visit 2 by body site.

(A) Distribution of change in Chao1 diversity from Visit 1 to Visit 2 for gut microbiota. (B) Distribution of change in Chao1 diversity from Visit 1 to Visit 2 for oral microbiota. (C) Distribution of change in Chao1 diversity from Visit 1 to Visit 2 for vaginal microbiota. (D) Distribution of change in Shannon diversity from Visit 1 to Visit 2 for gut microbiota. (E) Distribution of change in Shannon diversity from Visit 1 to Visit 2 for oral microbiota. (F) Distribution of change in Shannon diversity from Visit 1 to Visit 2 for vaginal microbiota.
