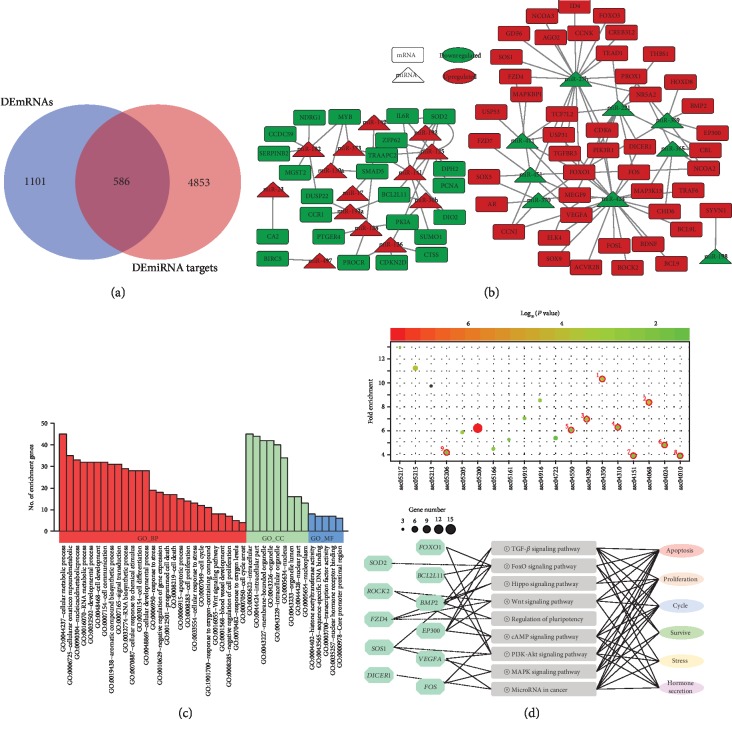
Figure 4.
DEmiRNA-DEmRNA regulatory network analysis. (a) Venn diagram showing the overlapping genes that simultaneously belong to the DEmRNAs and the predicted target genes of the DEmiRNAs. (b) DEmiRNA-DEmRNA regulatory network. Rectangles and triangles indicate DEmRNAs and DEmiRNAs, respectively. Red and green indicate up- and downregulated, respectively. (c) Gene Ontology (GO) analysis for DEmiRNA-DEmRNA regulatory axes in porcine GCs underlying oxidative stress. (d) KEGG pathway enrichment analysis for DEmiRNA-DEmRNA regulatory axes (upper) and gene-pathway-function coregulation network was established (lower).

