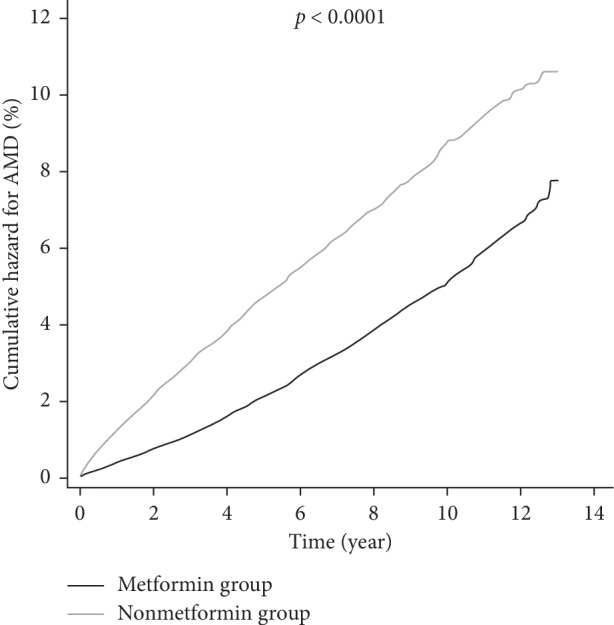
Figure 2.

Kaplan–Meier curves for AMD among the metformin group and the nonmetformin group. The black line represents the metformin group and the gray line represents the nonmetformin group. AMD: age-related macular degeneration.

Kaplan–Meier curves for AMD among the metformin group and the nonmetformin group. The black line represents the metformin group and the gray line represents the nonmetformin group. AMD: age-related macular degeneration.