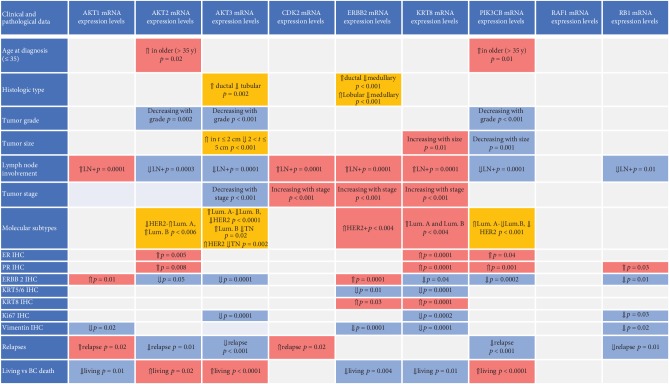
Figure 1.
Graphical summary, representing associations among the mRNA expression of the analyzed genes and clinical-pathological variables. The red boxes indicate higher expression levels, the blue boxes indicate lower expression levels, and orange boxes are indicative of mixed associations. “Lum” stands for luminal and “IHC” for immunohistochemistry. IHC data are defined as positive or negative according to the already defined cutoffs.

