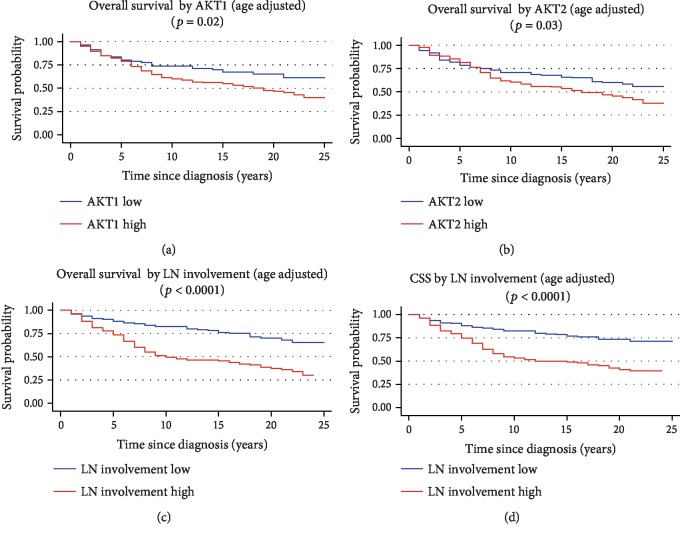
Figure 5.
Age-adjusted Kaplan-Meyer overall survival curves for AKT1 expression (a), AKT2 expression (b), and LN involvement variable (c) in the entire cohort. Age-adjusted cancer-specific survival curves for LN involvement (d) in the entire cohort of patients. The gene expression was dichotomized in low expression and high expression for the median value of each transcript; the cutoff value for the LN involvement variable has been defined by ROC analysis. The graphs of the survivor function were adjusted to the mean age of patients (46.9 years). CSS: cancer-specific survival (p values on the graph refer to the log-rank test).

