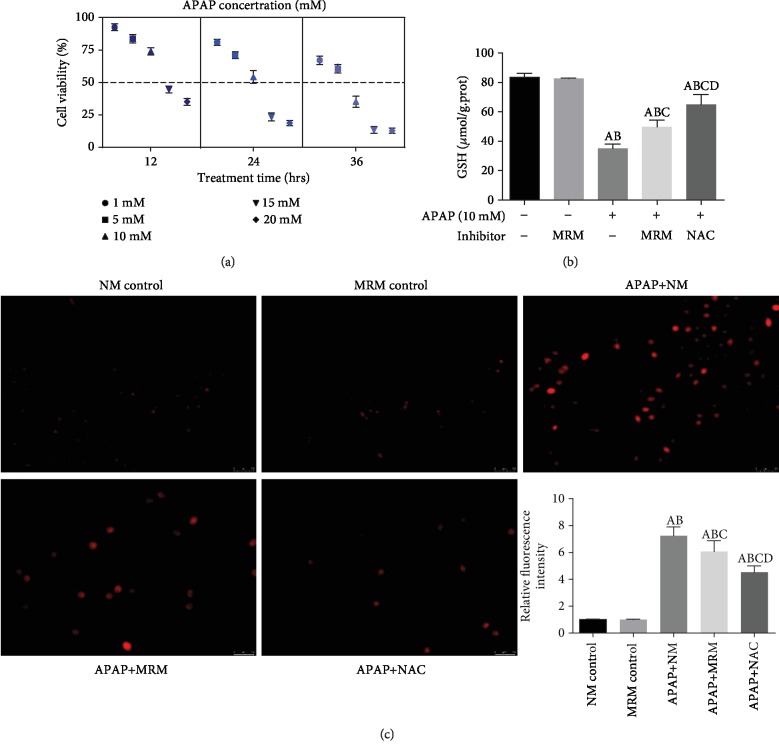
Figure 6.
MRS inhibited APAP-induced cellular oxidative stress. (a) Cell viability after treatment with APAP at doses of 5 mM, 10 mM, 15 mM, and 20 mM for 12 h, 24 h, and 36 h exposure, respectively; (b) GSH level in L-02 cells after treatment with 10 mM APAP concentration for 24 h; (c) immunofluorescence of ROS expression and (b) relative fluorescence intensity in the L-02 cells (Ap < 0.05 as compared to the NM group, Bp < 0.05 as compared to the MRM group, Cp < 0.05 as compared to the APAP+NM group, and Dp < 0.05 as compared to the APAP+MRM group).

