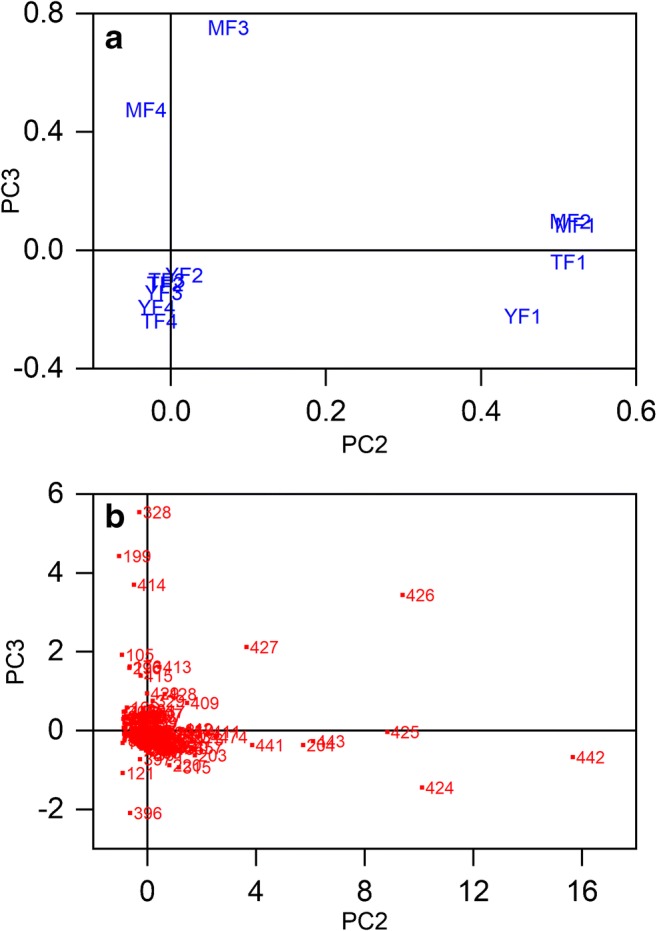
Fig. 4.

PCA calculation results of DAPPI-MS analysis of B. pendula bark fractions: a loadings plot showing the correlations between the chemical profiles of the samples from all the four fractions collected from three tree heights: mature stem (MF1–MF4), transition zone (TF1–TF4), and young apical stem (YF1–YF4), and b the score plot of the selected m/z peaks
