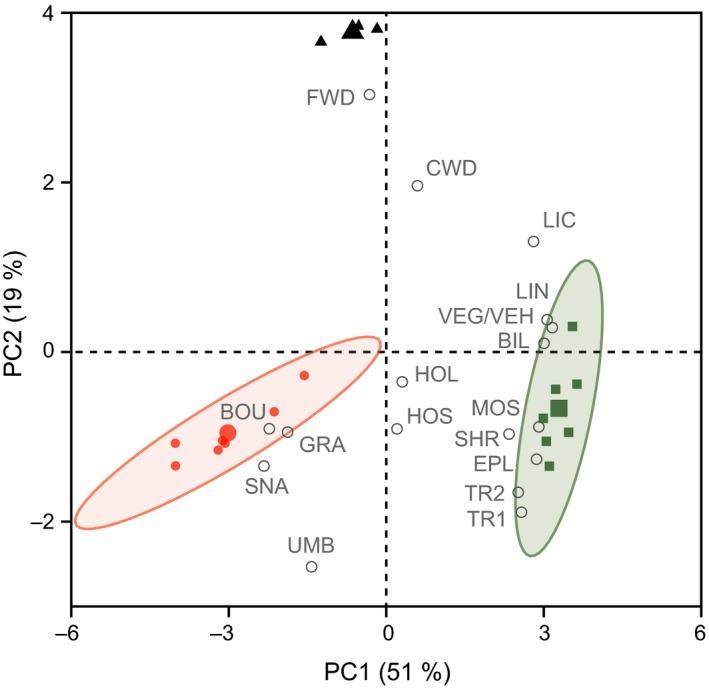
Figure 3.

Biplot of results from principal component analysis (PCA) on structural habitat factors (white circles) in the three studied forest types (unburnt forest, green squares; fire area, red filled circles; clear‐cuts, black triangles; large symbols indicate mean values). The ellipses show the 95% confidence intervals for the respective forest types (for clear‐cuts, no confidence intervals could be calculated due to too few data points). The percentage of explained variance is given in parentheses for the two PCs. BIL cover of bilberry, BOU cover of boulders, CWD total length of coarse woody debris, EPL cover of epiphytic lichens on trees, FWD cover of fine woody debris, GRA grass cover, HOL number of large stoneholes, HOS number of small stoneholes, LIC lichen cover, LIN cover of lingonberry, MOS moss cover, TR1 cover of tree layer 1, TR2 cover of tree layer 2, SHR cover of shrubs, SNA number of snags, UMB cover of umbrella vegetation, VEG vegetation cover in the field layer, and VEH height of vegetation in the field layer. VEG and VEH yielded the same loadings
