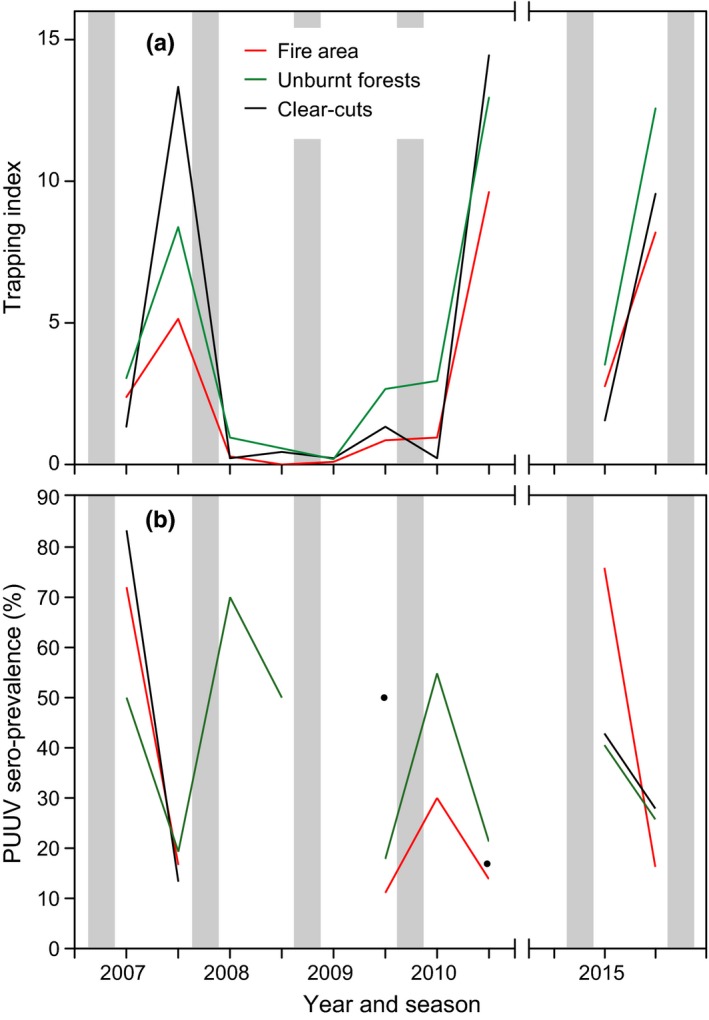
Figure 4.

Mean trapping index of bank voles (Myodes glareolus) (a) and PUUV sero‐prevalence in bank voles (b) in the fire area (red line), unburnt reference forests (green line) and clear‐cuts (black line) in spring and autumn 2007–2010 and 2015. Shading indicates winter. The black filled circles in (b) show PUUV sero‐prevalence in the clear‐cut area in autumn 2009 and 2010. In (b) PUUV prevalence is shown for seasons that yielded at least five bank voles
