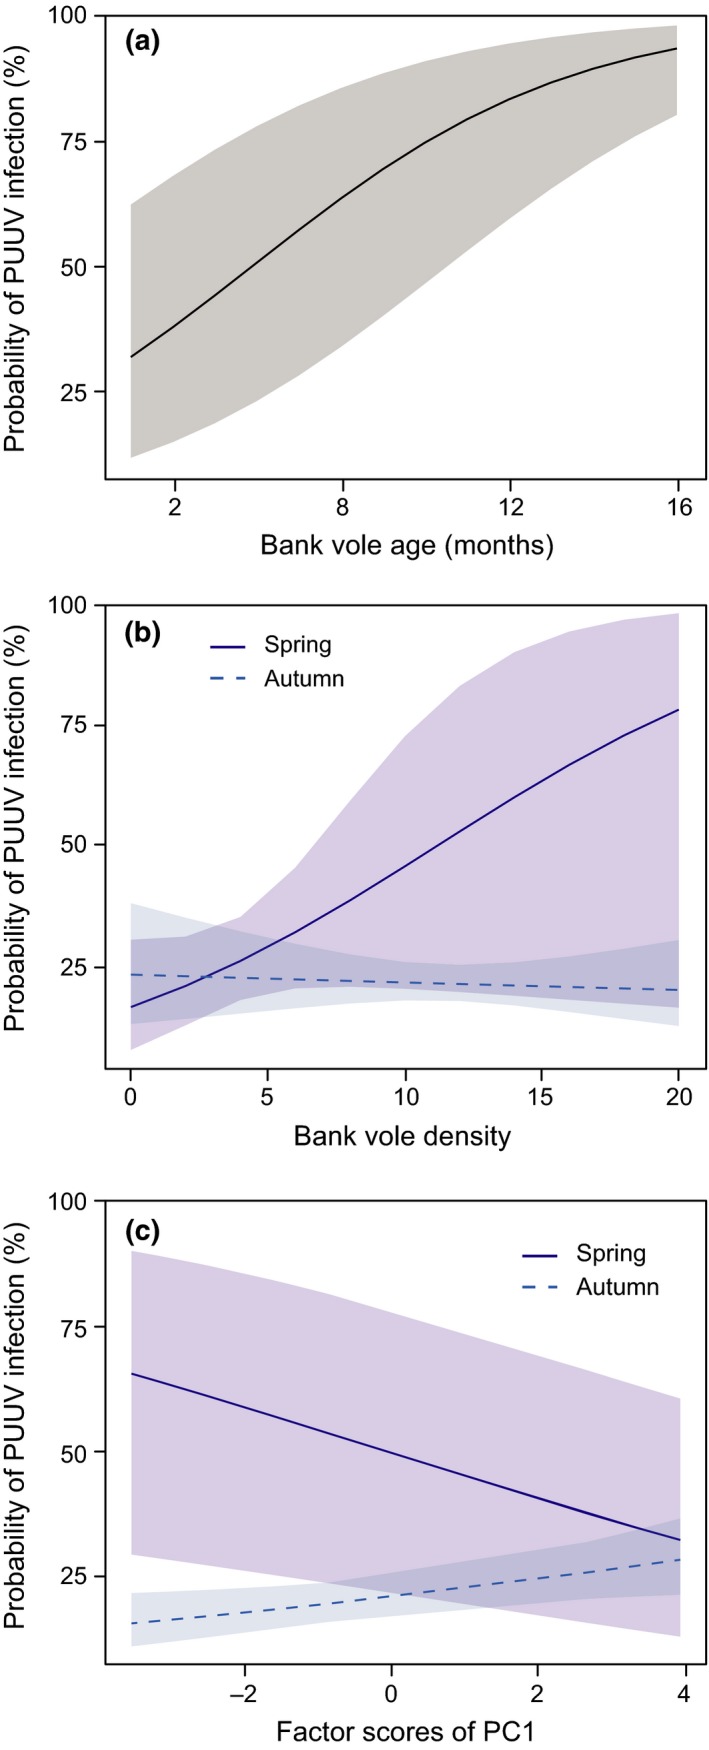
Figure 6.

Predicted probability of PUUV sero‐positivity (probability of PUUV infection) in bank voles as a function of (a) vole age, (b) bank vole density (number of trapped bank voles per 100 trap‐nights), and (c) factor loadings of the first principal component (PC1) on the vegetation and structural habitat factors studied at each trapping plot (cf. Figure 3). High factor loadings represent heterogeneous trapping plots, rich in vegetation with multiple shrub and tree layers, while low loadings imply low vegetation cover (except grasses), high cover of boulders and high number of snags (cf. Figure 3). In (b) and (c) probability was calculated separately for spring and autumn. The shaded areas represent the 95% confidence interval of coefficient estimates
