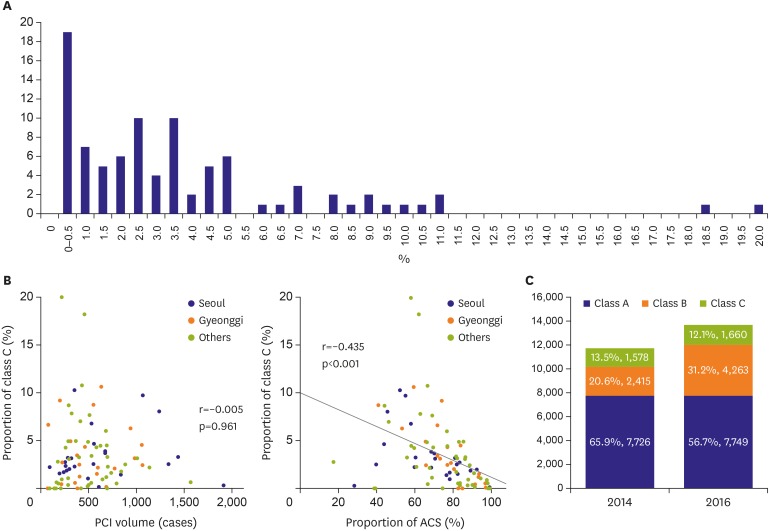
Figure 4. KP3. (A) The proportion of class C by hospitals, (B) Relationship between the proportion of class C in the hospital and the number of PCIs performed in the hospital (left) and the proportion of ACS cases in the hospital (right). (C) Changes of the distribution of KP3 class in non-ACS patients from 2014 to 2016.
ACS = acute coronary syndrome; KP3 = Korean percutaneous coronary intervention practice pattern; PCI = percutaneous coronary intervention.

