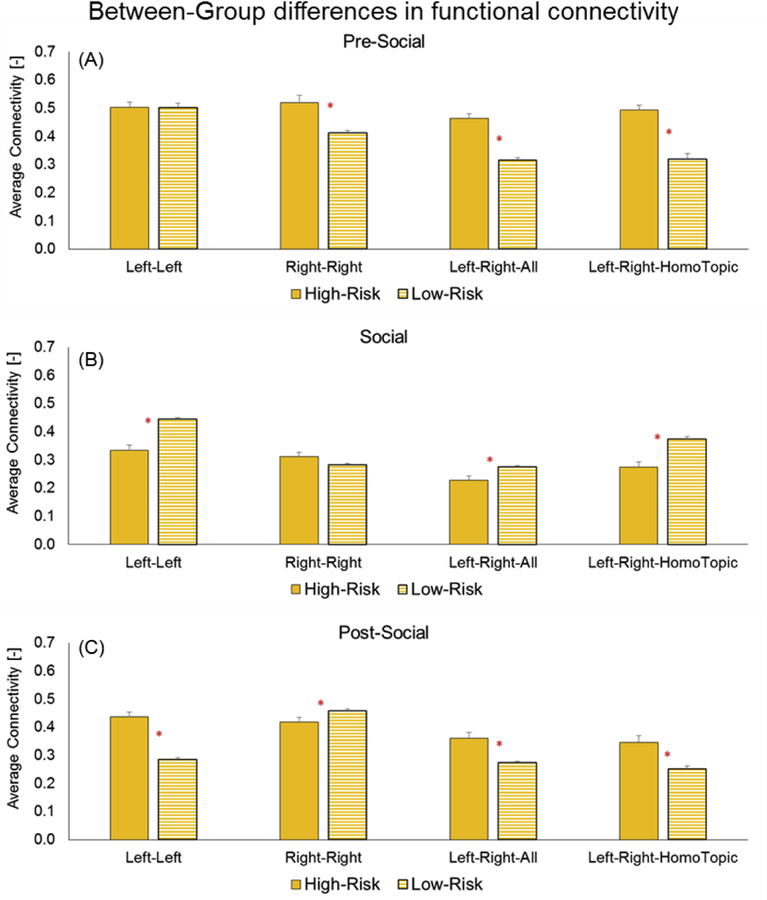
Figure 7:
Group differences in functional connectivity for three periods: A) Pre-social, B) Social, and C) Post-social. X-axis lists the different types of FC - intra-hemispheric (left-left, right-right) and inter-hemispheric (for all channels and for homotopic channels only). Red asterisk (*) indicates significant group differences (p-values ranging from 0.001 to 0.0001).
Individual data confirm that all the infants within a group followed the connectivity group trends for their own group suggesting that our group trends are robust (Figure 8). We are also providing a visual depiction of the entire correlation matrix for one exemplar HR and LR infant for each period (Figure 9A–9F). Note the change in connectivity in the HR infant – greater connectivity in pre-social and post-social period and lower functional connectivity (FC) for the social period indicating a drop in connectivity during the social period (Figures 9A–9C). In contrast, the LR infant showed opposite connectivity profile with a slight increase in overall connectivity in the social period compared to the pre- and post-social period (Figures 9D–9F).

