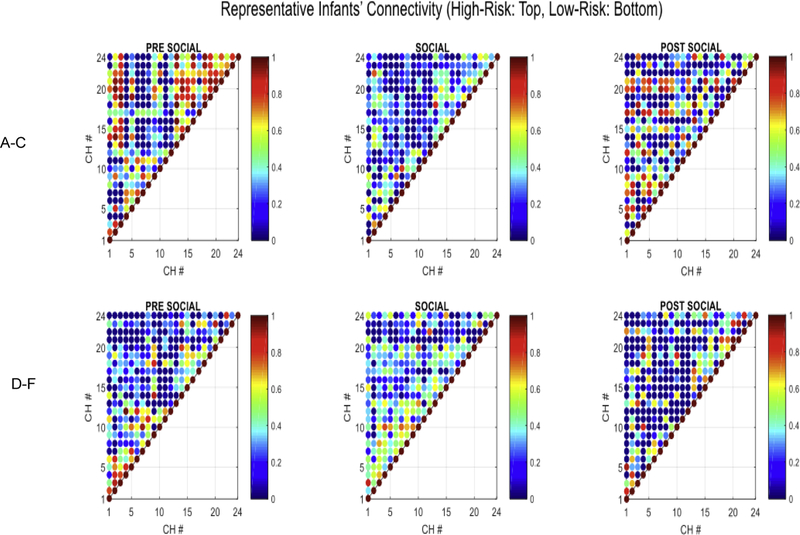
Figure 9.
shows a visual depiction of correlation matrices obtained for the pre-social (A, D), social (B, E) and post-social (C, F) for one HR infant (A–C) and one LR infant (D–F). Each point represents a specific channel correlation and values range from 0 = blue to 1 = red and shades in between. The HR infant had higher FC in the pre- and post-social periods compared to the social period. The LR infant had higher FC in the social period compared to the pre- and post-social periods.

