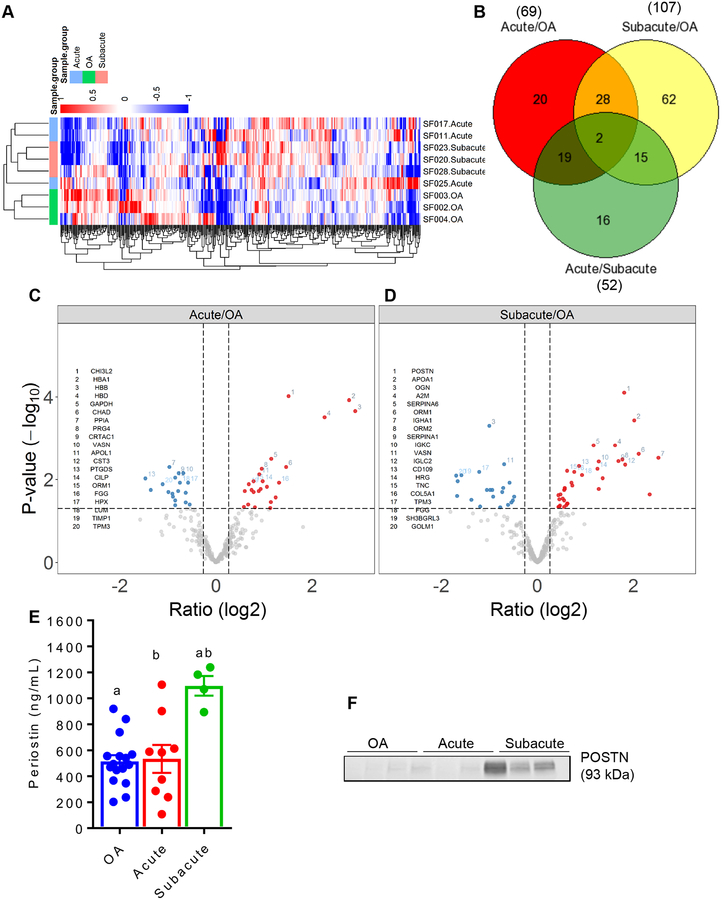
Figure 1.
A. Unsupervised clustering of the protein abundances relative to the reference standard generated from all samples analyzed using synovial fluid proteomic: acute (N = 3) and subacute (N = 3) tear groups and OA (N = 3) group. B. Venn diagram for the number of proteins that differed between any two groups and the number of proteins that were common to any two or all three groups. C-D. Volcano plot showing differentially expressed proteins between acute tear and OA groups (C) and between subacute tear and OA groups (D). The cutoffs for the horizontal dotted lines are at a P value of 0.05 and the cutoff for the vertical dotted lines are at an absolute fold change of 1.2. Blue dots represent proteins that are low in acute/OA comparison or subacute/OA comparison, while red dots show proteins higher in these comparisons. E. Multiplex assays performed on synovial fluid from acute (N = 9) and subacute (N = 4) tear groups and OA (N = 16) group confirmed significantly higher concentration of POSTN protein in the subacute tear group compared to both acute tear and OA groups. Kruskal-Wallis with Dunn’s multiple comparison test. Each bar graph is presented as mean ± standard error of the mean. Similar lowercase letters (a, b) indicate statistical significance across groups at P < 0.05. F. Western blot analysis of POSTN protein in the synovial fluid of selected patients further showed that the subacute tear group had strong bands corresponding to high POSTN protein compared to both acute tear and OA groups.

