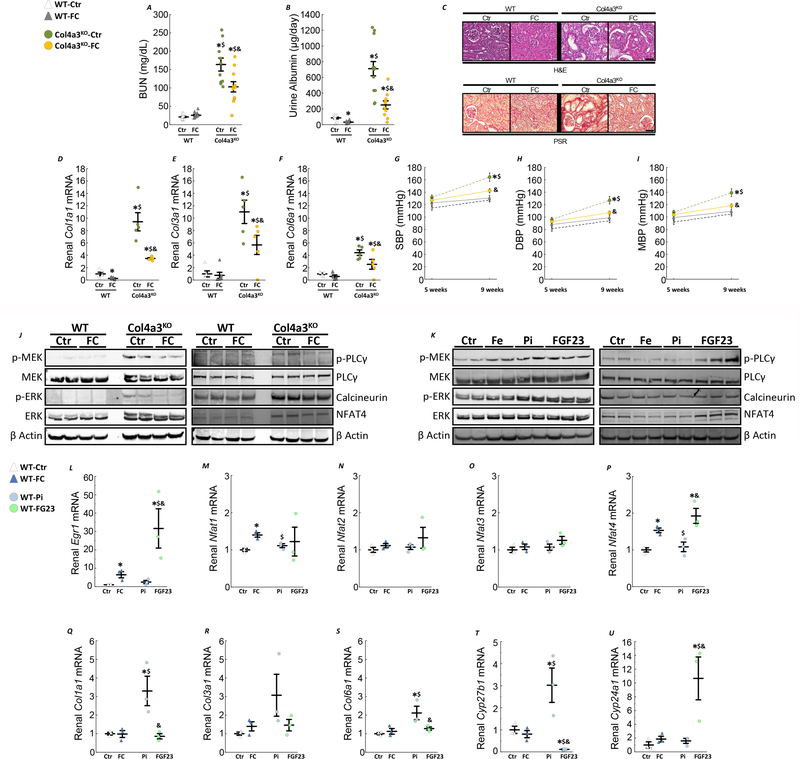
Figure 7: Ferric citrate administration in mice with early CKD slows CKD progression.
Levels of serum BUN (A), urine albumin (B) in 10 week old WT and Col4a3KO mice fed a mineral sufficient diet (Ctr) supplemented or not with 5% ferric citrate (FC) during 6 weeks. Data are presented as mean ± SE, n≥8 per group, p<0.05 vs.* WT-Ctr, $ WT-FC, & Col4a3KO-Ctr mice. Representative sections of kidney stained with hematoxylin & eosin or picro-sirius red staining (C, bar=50 μm) and renal mRNA expression of markers of fibrosis, Col1a1 (D), Col3a1 (E) and Col6a1 (F). Measurements performed in 10 week old WT and Col4a3KO mice fed a mineral sufficient diet (Ctr) supplemented or not with 5% ferric citrate (FC) during 6 weeks. Data are presented as mean ± SE, n≥5 per group, p<0.05 vs.* WT-Ctr, $ WT-FC, & Col4a3KO-Ctr mice. Non-invasive systolic (G), diastolic (H) and mean blood pressure (I). Data are presented as mean ± SE, n≥11 per group, p<0.05 vs.* WT-Ctr, $ WT-FC, & Col4a3KO-Ctr mice. (J) Representative immunoblots of kidney protein extracts stained for MEK/ERK and PLCγ/calcineurin/NFAT pathways activity. (K) Representative immunoblots of kidney protein extracts for MEK/ERK and PLCγ/calcineurin/NFAT pathways from 10 week old WT mice collected two hours post-injection of either 0.9% sodium chloride (Ctr), 25 μg/g ferric citrate (FC), 50 μg/g of sodium monobasic phosphate (Pi) or 50 ng/g of FGF23. Renal mRNA expression of FGF23 potential targets, Egr1 (L), Nfat1 (M), Nfat2 (N), Nfat3 (O), Nfat4 (P), markers of fibrosis, Col1a1 (Q), Col3a1 (R) and Col6a1 (S) and vitamin D enzymes Cyp27b1 (T), Cyp24a1 (T). Data are presented as mean ± SE, n≥3 per group, p<0.05 vs.* WT-Ctr, $ WT-FC, & WT-Pi mice.

