Figure 4.
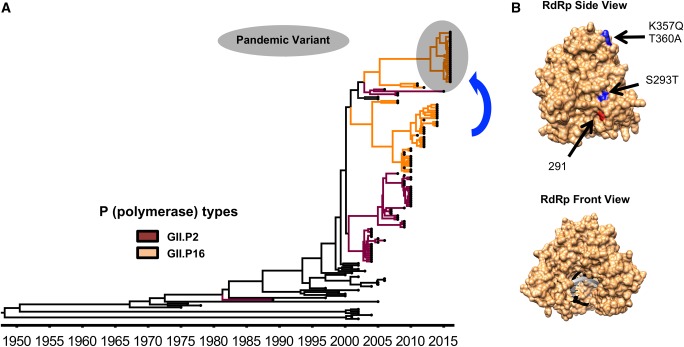
Evolution of GII.2 noroviruses. (A) MCC tree showing the circulation of different GII.2 noroviruses over time (Tohma et al. 2017). Branches with strains associated with the RdRp types GII.P2 and GII.P16 are indicated with dark red and orange, respectively. GII.2P[16] strains that caused large epidemics and spread worldwide are indicated with a gray shadow. The MCC tree was constructed using the BEAST package (Drummond et al. 2012) and visualized in FigTree v1.4.3. (B) A structural model of the norovirus RdRp is shown indicating the substitutions (blue) presented by the GII.2[P16] strains that predominated during 2016–17 in different countries (Kwok et al. 2017; Lu et al. 2017; Tohma et al. 2017). Substitutions on residue 291 (red) were shown to alter the mutation rate of GII.4 polymerases (Bull et al. 2010). The molecular model of the RdRp was visualized using an X-ray solved structure of norovirus RdRp (Protein Data Bank record: 4QPX) and was rendered in Chimera (Pettersen et al. 2004).

