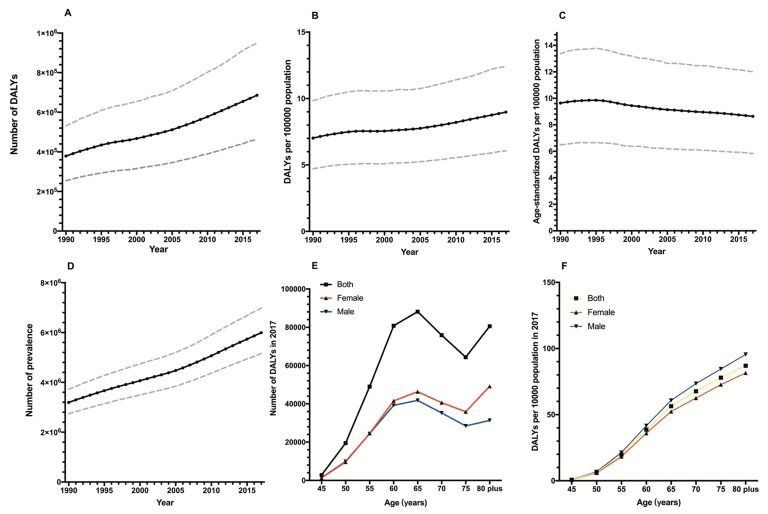
Figure 1.
Time trends of the global disease burden of glaucoma and prevalence from 1990-2016 and distributions by age in 2016. Panel A. DALY numbers. Panel B. DALY rates. Panel C. Age-standardized DALY rates. Panel D. Prevalence of glaucoma. Panel E. DALY numbers in 2017. Panel F. DALY rates in 2017. Dashed lines represent 95% uncertainty intervals. DALY – disability-adjusted life years.

