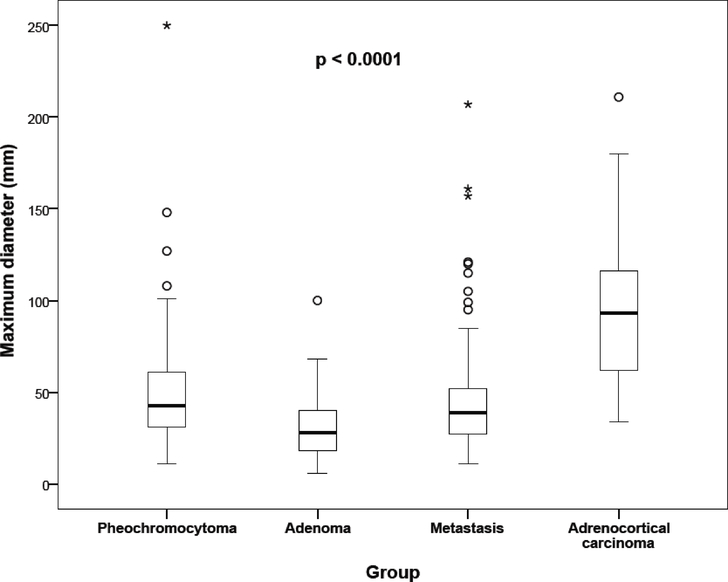
Fig. 6. Maximum diameter of adrenal masses in different histological groups.
Legend: the thick line represents the median, the bottom of the box stands for the first quartile, the top of the box for the third quartile, and the whiskers display the minimum and maximum non-distant values. The circles represent outliers and stars show extreme values.

